| - Aluminum, FIL, ICP-MS - |
| Lab: NWQL, PCode: 01106, MCode: PLM10 |
| Analysis Dates: 02/08/19 through 09/01/23 |
| Open Data Set |
| Boxplot Description |
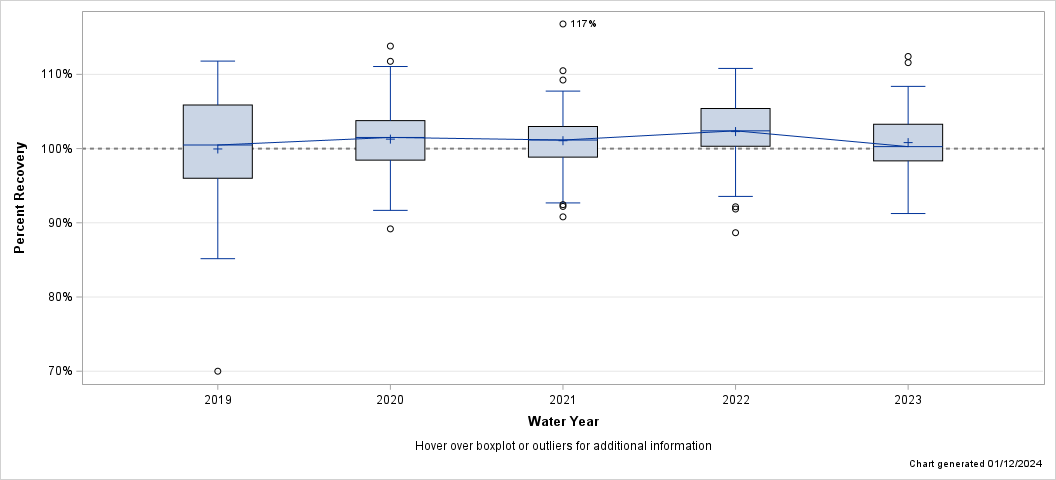
| - Aluminum, FIL, ICP-MS - |
| Lab: NWQL, PCode: 01106, MCode: PLM10 |
| Analysis Dates: 02/08/19 through 09/01/23 |
| Open Data Set |
| Boxplot Description |

| Percent Recovery Statistics for Aluminum, FIL, ICP-MS |
| Analyte | Parm-meth Code | Water Year | # of Samples |
25th Pctl | 50th Pctl (Median) |
75th Pctl |
|---|---|---|---|---|---|---|
| Aluminum, FIL, ICP-MS | 01106PLM10 | 2019 | 61 | 96.0% | 100.5% | 105.9% |
| 2020 | 86 | 98.5% | 101.5% | 103.8% | ||
| 2021 | 90 | 98.8% | 101.2% | 103.0% | ||
| 2022 | 88 | 100.3% | 102.4% | 105.4% | ||
| 2023 | 75 | 98.3% | 100.3% | 103.3% |
| Hover over boxplot or outliers for additional information |
| Chart generated 01/12/2024 |
| - Aluminum, FIL, ICP-MS - |
| Lab: NWQL, PCode: 01106, MCode: PLM43 |
| Analysis Dates: 10/01/08 through 01/29/19 |
| Open Data Set |
| Boxplot Description |
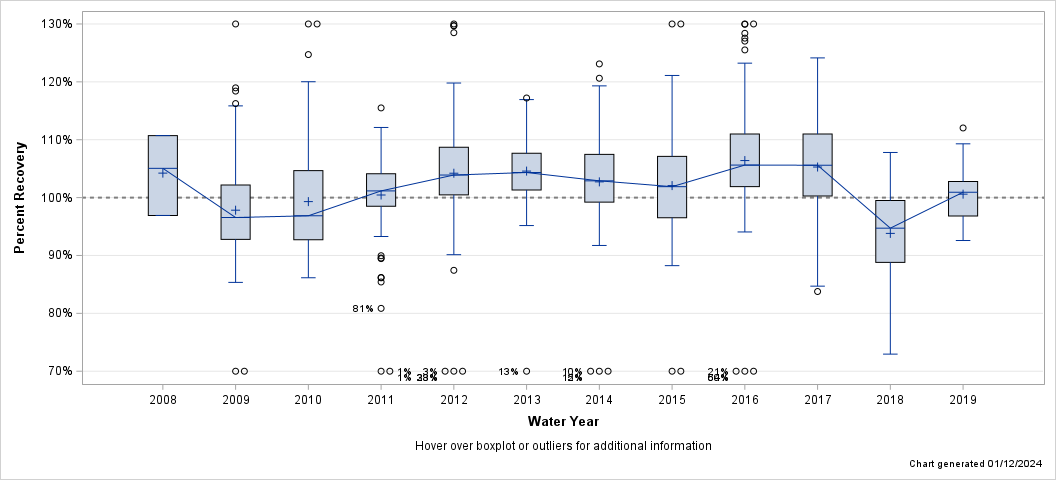
| Percent Recovery Statistics for Aluminum, FIL, ICP-MS |
| Analyte | Parm-meth Code | Water Year | # of Samples |
25th Pctl | 50th Pctl (Median) |
75th Pctl |
|---|---|---|---|---|---|---|
| Aluminum, FIL, ICP-MS | 01106PLM43 | 2008 | 3 | 96.9% | 105.1% | 110.7% |
| 2009 | 105 | 92.8% | 96.6% | 102.2% | ||
| 2010 | 132 | 92.7% | 96.9% | 104.7% | ||
| 2011 | 131 | 98.5% | 101.2% | 104.1% | ||
| 2012 | 132 | 100.5% | 103.9% | 108.7% | ||
| 2013 | 108 | 101.3% | 104.3% | 107.7% | ||
| 2014 | 83 | 99.2% | 102.9% | 107.5% | ||
| 2015 | 90 | 96.5% | 101.9% | 107.1% | ||
| 2016 | 90 | 101.9% | 105.6% | 111.0% | ||
| 2017 | 90 | 100.3% | 105.6% | 111.0% | ||
| 2018 | 90 | 88.8% | 94.7% | 99.5% | ||
| 2019 | 19 | 96.8% | 100.9% | 102.8% |
| Hover over boxplot or outliers for additional information |
| Chart generated 01/12/2024 |
| - Aluminum, UNF, ICP-MS - |
| Lab: NWQL, PCode: 01105, MCode: PLM48 |
| Analysis Dates: 10/15/08 through 04/30/15 |
| Open Data Set |
| Boxplot Description |
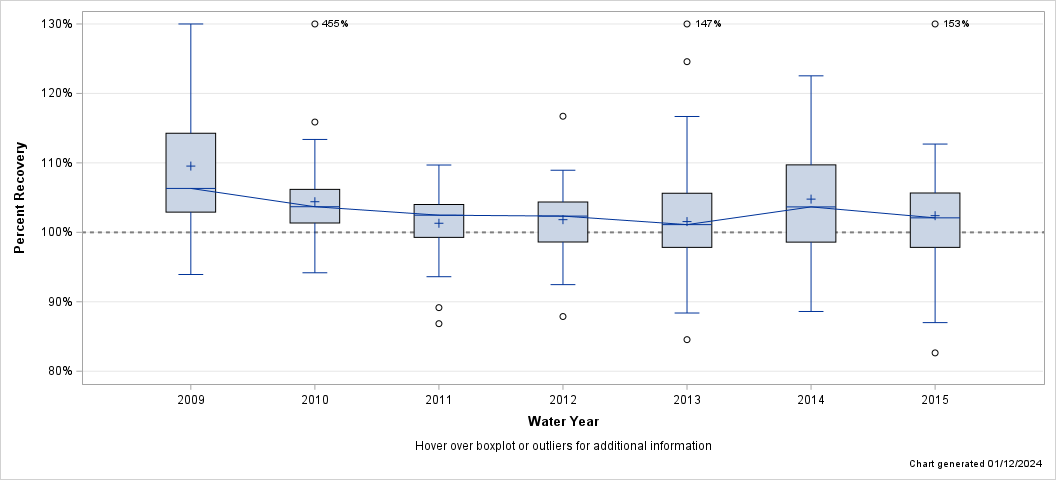
| Percent Recovery Statistics for Aluminum, UNF, ICP-MS |
| Analyte | Parm-meth Code | Water Year | # of Samples |
25th Pctl | 50th Pctl (Median) |
75th Pctl |
|---|---|---|---|---|---|---|
| Aluminum, UNF, ICP-MS | 01105PLM48 | 2009 | 39 | 102.9% | 106.3% | 114.3% |
| 2010 | 48 | 101.3% | 103.7% | 106.2% | ||
| 2011 | 48 | 99.3% | 102.5% | 104.0% | ||
| 2012 | 48 | 98.6% | 102.3% | 104.4% | ||
| 2013 | 96 | 97.8% | 101.1% | 105.6% | ||
| 2014 | 45 | 98.6% | 103.7% | 109.7% | ||
| 2015 | 27 | 97.8% | 102.1% | 105.7% |
| Hover over boxplot or outliers for additional information |
| Chart generated 01/12/2024 |
| - Aluminum, UNF, ICP-MS - |
| Lab: NWQL, PCode: 01105, MCode: PLM77 |
| Analysis Dates: 02/05/19 through 09/27/23 |
| Open Data Set |
| Boxplot Description |
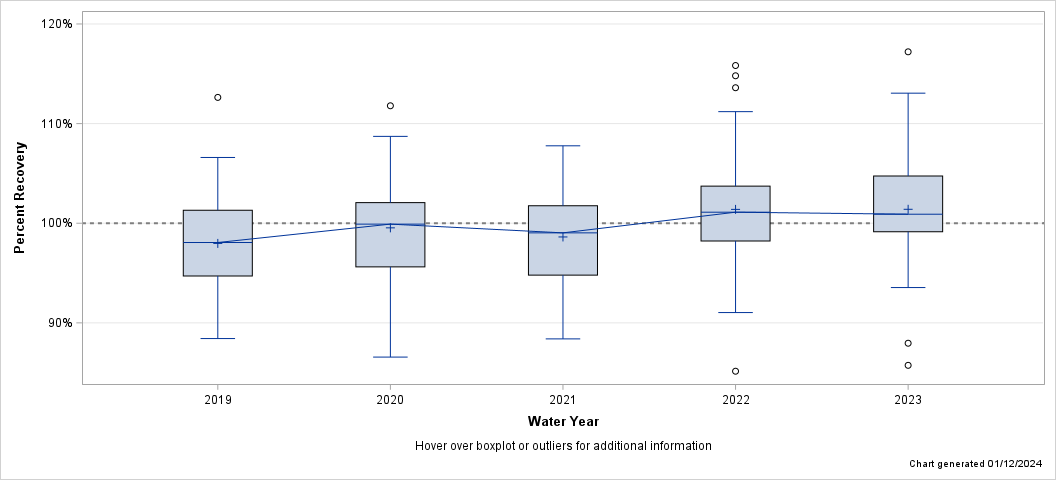
| Percent Recovery Statistics for Aluminum, UNF, ICP-MS |
| Analyte | Parm-meth Code | Water Year | # of Samples |
25th Pctl | 50th Pctl (Median) |
75th Pctl |
|---|---|---|---|---|---|---|
| Aluminum, UNF, ICP-MS | 01105PLM77 | 2019 | 37 | 94.7% | 98.1% | 101.3% |
| 2020 | 44 | 95.6% | 99.9% | 102.1% | ||
| 2021 | 48 | 94.8% | 99.0% | 101.7% | ||
| 2022 | 46 | 98.2% | 101.1% | 103.7% | ||
| 2023 | 44 | 99.1% | 100.9% | 104.7% |
| Hover over boxplot or outliers for additional information |
| Chart generated 01/12/2024 |
| - Aluminum, UNF, ICP-MS - |
| Lab: NWQL, PCode: 01105, MCode: PLM78 |
| Analysis Dates: 05/12/15 through 11/27/18 |
| Open Data Set |
| Boxplot Description |
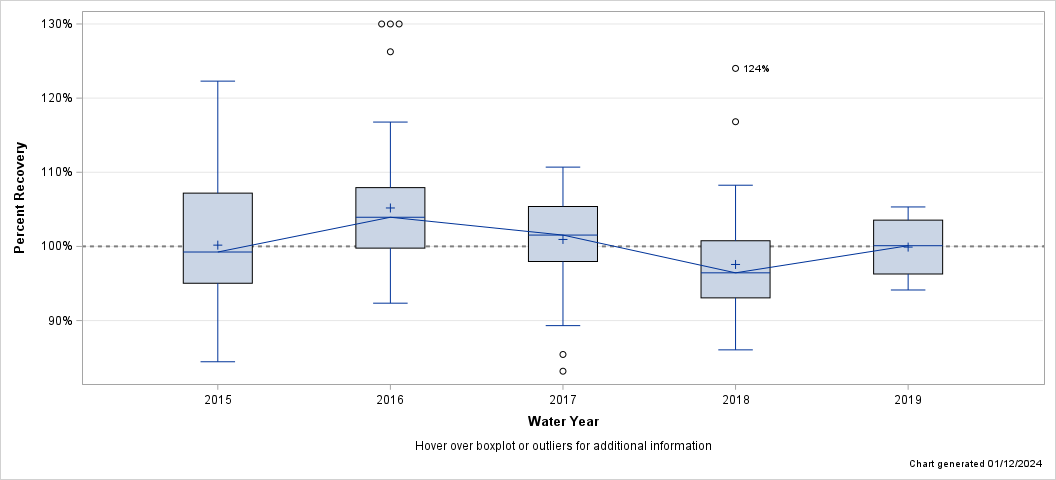
| Percent Recovery Statistics for Aluminum, UNF, ICP-MS |
| Analyte | Parm-meth Code | Water Year | # of Samples |
25th Pctl | 50th Pctl (Median) |
75th Pctl |
|---|---|---|---|---|---|---|
| Aluminum, UNF, ICP-MS | 01105PLM78 | 2015 | 31 | 95.0% | 99.2% | 107.2% |
| 2016 | 65 | 99.8% | 103.9% | 107.9% | ||
| 2017 | 48 | 98.0% | 101.5% | 105.4% | ||
| 2018 | 48 | 93.1% | 96.4% | 100.8% | ||
| 2019 | 4 | 96.3% | 100.1% | 103.5% |
| Hover over boxplot or outliers for additional information |
| Chart generated 01/12/2024 |
| - Antimony, FIL, ICP-MS - |
| Lab: NWQL, PCode: 01095, MCode: PLM43 |
| Analysis Dates: 10/01/08 through 09/01/23 |
| Open Data Set |
| Boxplot Description |
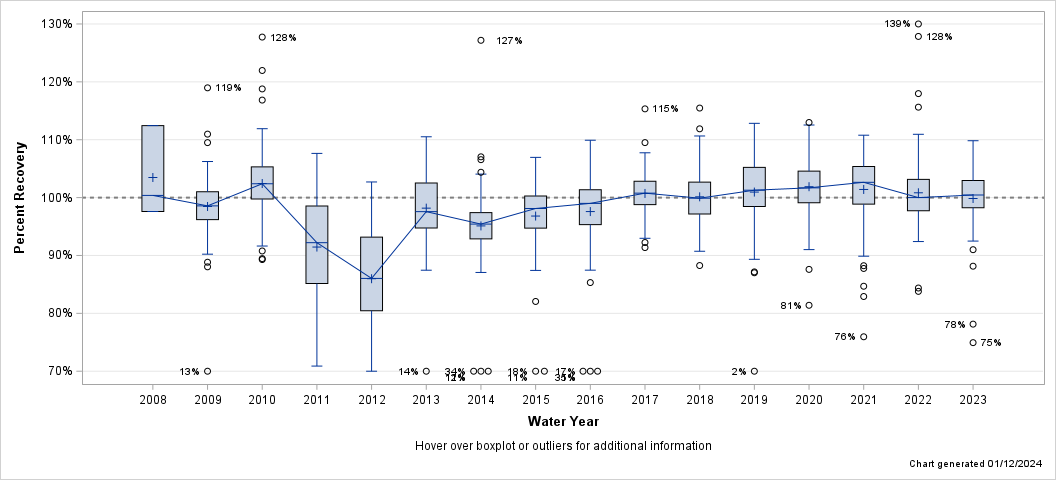
| Percent Recovery Statistics for Antimony, FIL, ICP-MS |
| Analyte | Parm-meth Code | Water Year | # of Samples |
25th Pctl | 50th Pctl (Median) |
75th Pctl |
|---|---|---|---|---|---|---|
| Antimony, FIL, ICP-MS | 01095PLM43 | 2008 | 3 | 97.6% | 100.4% | 112.4% |
| 2009 | 105 | 96.2% | 98.6% | 101.0% | ||
| 2010 | 132 | 99.8% | 102.4% | 105.3% | ||
| 2011 | 131 | 85.1% | 92.2% | 98.5% | ||
| 2012 | 132 | 80.4% | 86.0% | 93.2% | ||
| 2013 | 108 | 94.8% | 97.6% | 102.5% | ||
| 2014 | 83 | 92.9% | 95.4% | 97.4% | ||
| 2015 | 72 | 94.7% | 98.1% | 100.3% | ||
| 2016 | 74 | 95.3% | 99.0% | 101.3% | ||
| 2017 | 90 | 98.8% | 100.8% | 102.8% | ||
| 2018 | 90 | 97.2% | 99.9% | 102.7% | ||
| 2019 | 80 | 98.5% | 101.3% | 105.2% | ||
| 2020 | 85 | 99.1% | 101.7% | 104.6% | ||
| 2021 | 90 | 98.9% | 102.6% | 105.4% | ||
| 2022 | 88 | 97.7% | 100.0% | 103.2% | ||
| 2023 | 75 | 98.2% | 100.4% | 103.0% |
| Hover over boxplot or outliers for additional information |
| Chart generated 01/12/2024 |
| - Antimony, UNF, ICP-MS - |
| Lab: NWQL, PCode: 01097, MCode: PLM48 |
| Analysis Dates: 10/30/08 through 04/30/15 |
| Open Data Set |
| Boxplot Description |
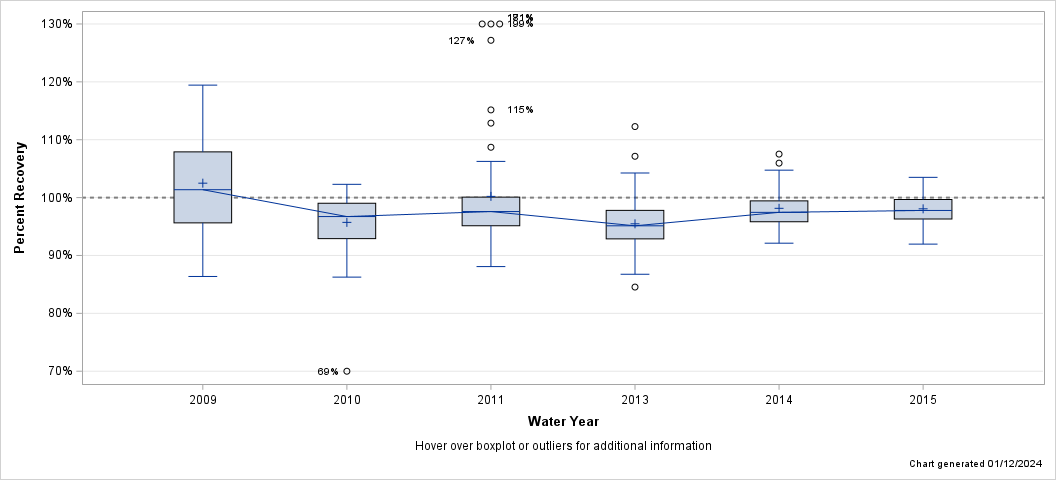
| Percent Recovery Statistics for Antimony, UNF, ICP-MS |
| Analyte | Parm-meth Code | Water Year | # of Samples |
25th Pctl | 50th Pctl (Median) |
75th Pctl |
|---|---|---|---|---|---|---|
| Antimony, UNF, ICP-MS | 01097PLM48 | 2009 | 32 | 95.6% | 101.4% | 107.9% |
| 2010 | 48 | 92.9% | 96.7% | 99.0% | ||
| 2011 | 48 | 95.1% | 97.6% | 100.1% | ||
| 2013 | 48 | 92.9% | 95.1% | 97.8% | ||
| 2014 | 32 | 95.8% | 97.5% | 99.4% | ||
| 2015 | 27 | 96.3% | 97.8% | 99.7% |
| Hover over boxplot or outliers for additional information |
| Chart generated 01/12/2024 |
| - Antimony, UNF, ICP-MS - |
| Lab: NWQL, PCode: 01097, MCode: PLM78 |
| Analysis Dates: 05/12/15 through 09/27/23 |
| Open Data Set |
| Boxplot Description |
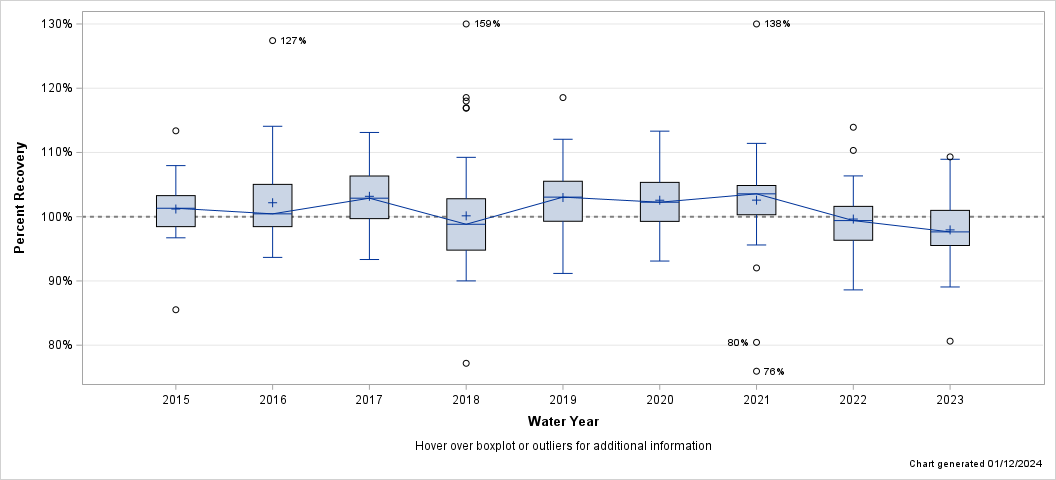
| Percent Recovery Statistics for Antimony, UNF, ICP-MS |
| Analyte | Parm-meth Code | Water Year | # of Samples |
25th Pctl | 50th Pctl (Median) |
75th Pctl |
|---|---|---|---|---|---|---|
| Antimony, UNF, ICP-MS | 01097PLM78 | 2015 | 21 | 98.5% | 101.3% | 103.3% |
| 2016 | 42 | 98.5% | 100.4% | 105.0% | ||
| 2017 | 48 | 99.7% | 102.9% | 106.3% | ||
| 2018 | 48 | 94.8% | 98.8% | 102.8% | ||
| 2019 | 41 | 99.3% | 103.0% | 105.5% | ||
| 2020 | 44 | 99.3% | 102.3% | 105.3% | ||
| 2021 | 48 | 100.3% | 103.6% | 104.9% | ||
| 2022 | 46 | 96.3% | 99.4% | 101.6% | ||
| 2023 | 44 | 95.5% | 97.6% | 101.0% |
| Hover over boxplot or outliers for additional information |
| Chart generated 01/12/2024 |
| - Arsenic, FIL, cICP-MS - |
| Lab: NWQL, PCode: 01000, MCode: PLM10 |
| Analysis Dates: 10/01/08 through 09/01/23 |
| Open Data Set |
| Boxplot Description |
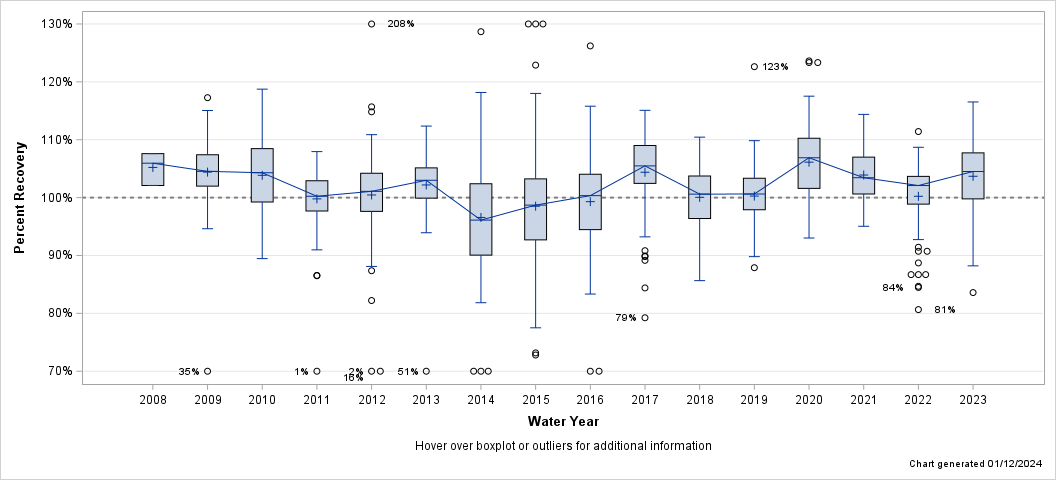
| Percent Recovery Statistics for Arsenic, FIL, cICP-MS |
| Analyte | Parm-meth Code | Water Year | # of Samples |
25th Pctl | 50th Pctl (Median) |
75th Pctl |
|---|---|---|---|---|---|---|
| Arsenic, FIL, cICP-MS | 01000PLM10 | 2008 | 3 | 102.1% | 105.9% | 107.6% |
| 2009 | 105 | 102.0% | 104.5% | 107.4% | ||
| 2010 | 132 | 99.2% | 104.3% | 108.5% | ||
| 2011 | 131 | 97.7% | 100.2% | 102.9% | ||
| 2012 | 132 | 97.6% | 101.1% | 104.2% | ||
| 2013 | 108 | 99.9% | 103.0% | 105.1% | ||
| 2014 | 83 | 90.0% | 96.1% | 102.4% | ||
| 2015 | 90 | 92.7% | 98.7% | 103.2% | ||
| 2016 | 90 | 94.5% | 100.3% | 104.0% | ||
| 2017 | 90 | 102.4% | 105.5% | 109.0% | ||
| 2018 | 90 | 96.4% | 100.6% | 103.7% | ||
| 2019 | 80 | 97.9% | 100.6% | 103.3% | ||
| 2020 | 85 | 101.6% | 106.9% | 110.2% | ||
| 2021 | 90 | 100.6% | 103.4% | 107.0% | ||
| 2022 | 88 | 98.9% | 102.1% | 103.7% | ||
| 2023 | 75 | 99.8% | 104.5% | 107.7% |
| Hover over boxplot or outliers for additional information |
| Chart generated 01/12/2024 |
| - Arsenic, UNF, cICP-MS - |
| Lab: NWQL, PCode: 01002, MCode: PLM11 |
| Analysis Dates: 10/06/08 through 04/30/15 |
| Open Data Set |
| Boxplot Description |
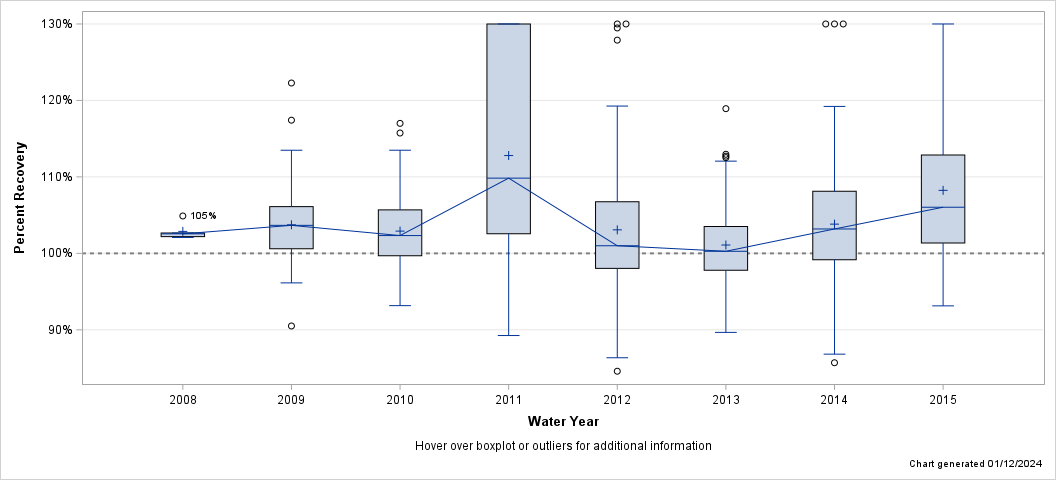
| Percent Recovery Statistics for Arsenic, UNF, cICP-MS |
| Analyte | Parm-meth Code | Water Year | # of Samples |
25th Pctl | 50th Pctl (Median) |
75th Pctl |
|---|---|---|---|---|---|---|
| Arsenic, UNF, cICP-MS | 01002PLM11 | 2008 | 5 | 102.2% | 102.6% | 102.7% |
| 2009 | 103 | 100.6% | 103.7% | 106.1% | ||
| 2010 | 131 | 99.7% | 102.3% | 105.7% | ||
| 2011 | 130 | 102.6% | 109.8% | 130.3% | ||
| 2012 | 83 | 98.0% | 101.0% | 106.7% | ||
| 2013 | 108 | 97.8% | 100.3% | 103.5% | ||
| 2014 | 70 | 99.2% | 103.2% | 108.1% | ||
| 2015 | 39 | 101.4% | 106.0% | 112.9% |
| Hover over boxplot or outliers for additional information |
| Chart generated 01/12/2024 |
| - Arsenic, UNF, cICP-MS - |
| Lab: NWQL, PCode: 01002, MCode: PLM77 |
| Analysis Dates: 05/12/15 through 09/27/23 |
| Open Data Set |
| Boxplot Description |
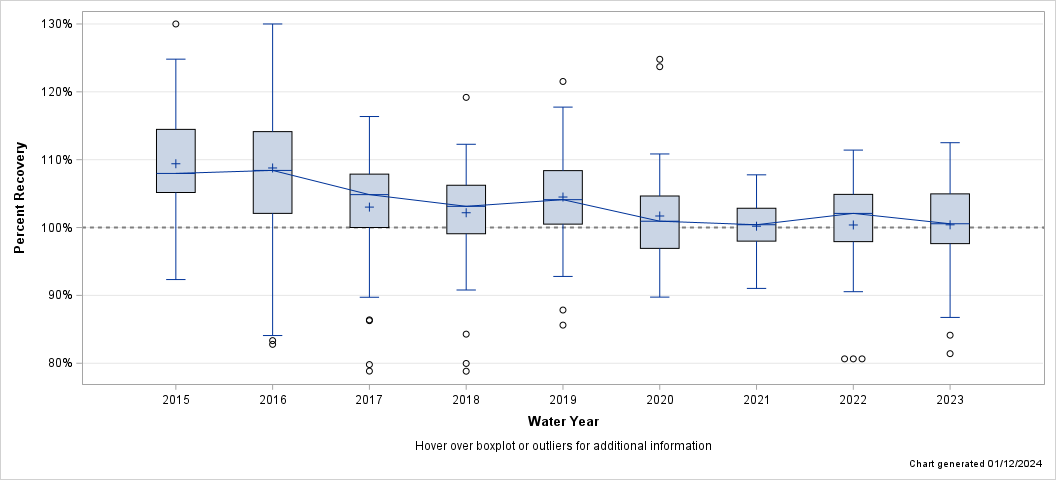
| Percent Recovery Statistics for Arsenic, UNF, cICP-MS |
| Analyte | Parm-meth Code | Water Year | # of Samples |
25th Pctl | 50th Pctl (Median) |
75th Pctl |
|---|---|---|---|---|---|---|
| Arsenic, UNF, cICP-MS | 01002PLM77 | 2015 | 40 | 105.2% | 108.0% | 114.5% |
| 2016 | 88 | 102.1% | 108.4% | 114.1% | ||
| 2017 | 90 | 100.0% | 104.8% | 107.9% | ||
| 2018 | 80 | 99.1% | 103.1% | 106.2% | ||
| 2019 | 56 | 100.5% | 104.1% | 108.4% | ||
| 2020 | 44 | 96.9% | 100.9% | 104.6% | ||
| 2021 | 48 | 98.0% | 100.4% | 102.8% | ||
| 2022 | 46 | 97.9% | 102.1% | 104.9% | ||
| 2023 | 44 | 97.6% | 100.6% | 105.0% |
| Hover over boxplot or outliers for additional information |
| Chart generated 01/12/2024 |
| - Barium, FIL, ICP-MS - |
| Lab: NWQL, PCode: 01005, MCode: PLM43 |
| Analysis Dates: 10/01/08 through 09/01/23 |
| Open Data Set |
| Boxplot Description |
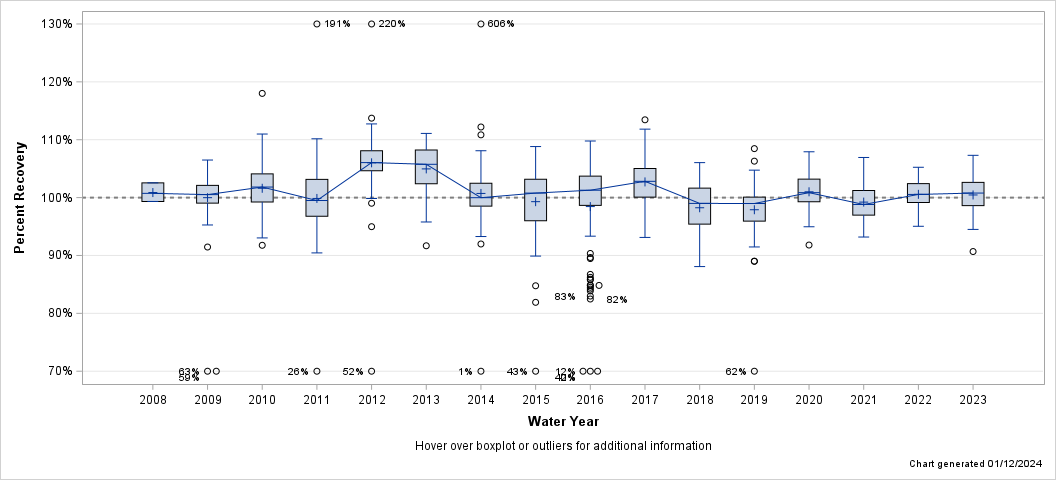
| Percent Recovery Statistics for Barium, FIL, ICP-MS |
| Analyte | Parm-meth Code | Water Year | # of Samples |
25th Pctl | 50th Pctl (Median) |
75th Pctl |
|---|---|---|---|---|---|---|
| Barium, FIL, ICP-MS | 01005PLM43 | 2008 | 3 | 99.3% | 100.7% | 102.5% |
| 2009 | 105 | 99.1% | 100.5% | 102.1% | ||
| 2010 | 132 | 99.2% | 101.8% | 104.1% | ||
| 2011 | 131 | 96.8% | 99.5% | 103.2% | ||
| 2012 | 132 | 104.6% | 106.0% | 108.1% | ||
| 2013 | 108 | 102.4% | 105.8% | 108.2% | ||
| 2014 | 83 | 98.5% | 100.0% | 102.5% | ||
| 2015 | 90 | 96.0% | 100.8% | 103.2% | ||
| 2016 | 90 | 98.7% | 101.3% | 103.7% | ||
| 2017 | 90 | 100.1% | 102.8% | 105.0% | ||
| 2018 | 90 | 95.4% | 99.0% | 101.6% | ||
| 2019 | 80 | 95.9% | 99.0% | 100.1% | ||
| 2020 | 85 | 99.3% | 100.9% | 103.2% | ||
| 2021 | 90 | 97.0% | 98.8% | 101.2% | ||
| 2022 | 88 | 99.1% | 100.5% | 102.4% | ||
| 2023 | 75 | 98.6% | 100.8% | 102.6% |
| Hover over boxplot or outliers for additional information |
| Chart generated 01/12/2024 |
| - Barium, FIL, ICP-OES - |
| Lab: NWQL, PCode: 01005, MCode: PLA11 |
| Analysis Dates: 10/04/08 through 09/28/23 |
| Open Data Set |
| Boxplot Description |
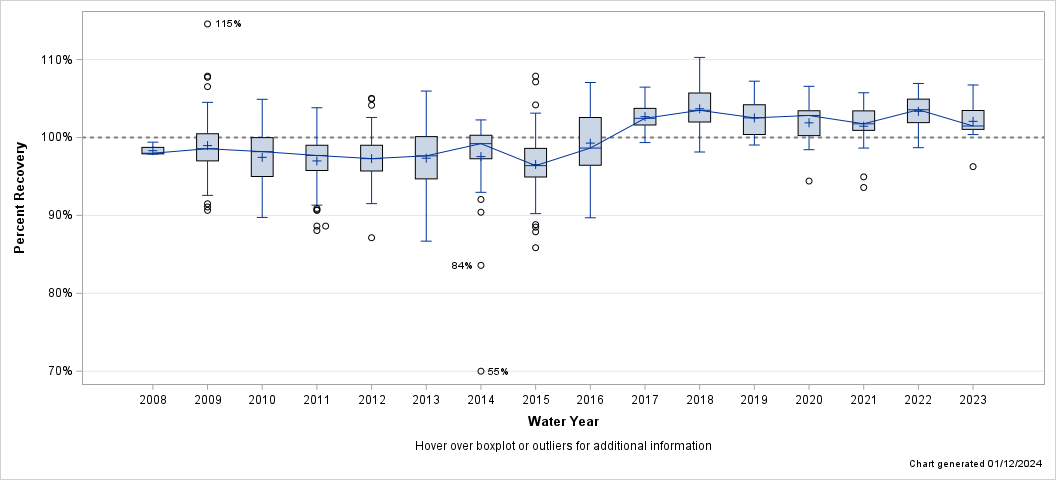
| Percent Recovery Statistics for Barium, FIL, ICP-OES |
| Analyte | Parm-meth Code | Water Year | # of Samples |
25th Pctl | 50th Pctl (Median) |
75th Pctl |
|---|---|---|---|---|---|---|
| Barium, FIL, ICP-OES | 01005PLA11 | 2008 | 4 | 97.9% | 98.0% | 98.7% |
| 2009 | 110 | 97.0% | 98.6% | 100.5% | ||
| 2010 | 42 | 95.0% | 98.2% | 100.0% | ||
| 2011 | 41 | 95.8% | 97.7% | 99.0% | ||
| 2012 | 42 | 95.7% | 97.3% | 99.0% | ||
| 2013 | 42 | 94.7% | 97.6% | 100.1% | ||
| 2014 | 46 | 97.3% | 99.2% | 100.3% | ||
| 2015 | 42 | 94.9% | 96.4% | 98.6% | ||
| 2016 | 41 | 96.4% | 98.6% | 102.6% | ||
| 2017 | 24 | 101.6% | 102.5% | 103.7% | ||
| 2018 | 24 | 102.0% | 103.5% | 105.7% | ||
| 2019 | 21 | 100.4% | 102.5% | 104.2% | ||
| 2020 | 24 | 100.2% | 102.8% | 103.4% | ||
| 2021 | 24 | 100.9% | 101.8% | 103.4% | ||
| 2022 | 24 | 101.9% | 103.6% | 104.9% | ||
| 2023 | 24 | 101.0% | 101.5% | 103.5% |
| Hover over boxplot or outliers for additional information |
| Chart generated 01/12/2024 |
| - Barium, UNF, ICP-MS - |
| Lab: NWQL, PCode: 01007, MCode: PLM47 |
| Analysis Dates: 10/15/08 through 04/30/15 |
| Open Data Set |
| Boxplot Description |
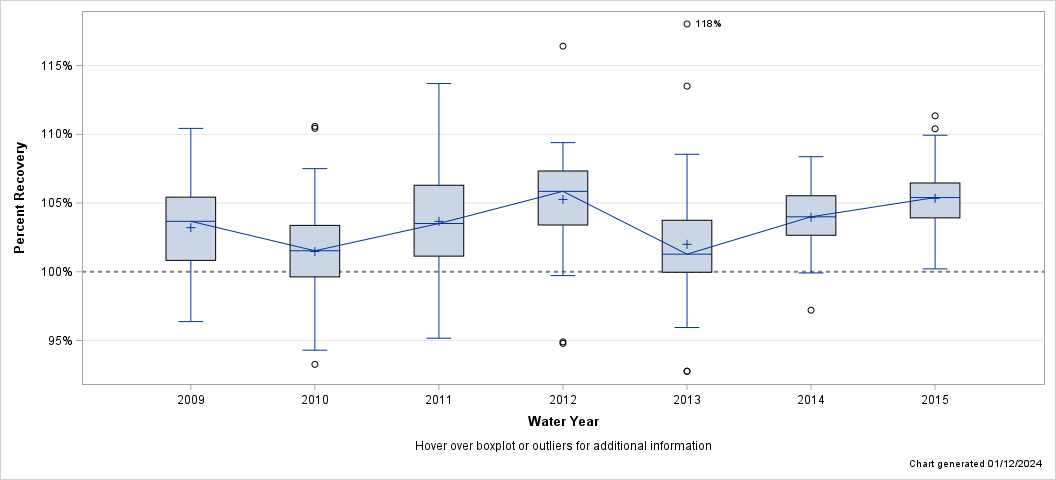
| Percent Recovery Statistics for Barium, UNF, ICP-MS |
| Analyte | Parm-meth Code | Water Year | # of Samples |
25th Pctl | 50th Pctl (Median) |
75th Pctl |
|---|---|---|---|---|---|---|
| Barium, UNF, ICP-MS | 01007PLM47 | 2009 | 39 | 100.8% | 103.7% | 105.4% |
| 2010 | 84 | 99.6% | 101.5% | 103.4% | ||
| 2011 | 82 | 101.1% | 103.5% | 106.3% | ||
| 2012 | 48 | 103.4% | 105.9% | 107.3% | ||
| 2013 | 48 | 100.0% | 101.3% | 103.7% | ||
| 2014 | 45 | 102.7% | 104.0% | 105.5% | ||
| 2015 | 27 | 103.9% | 105.4% | 106.5% |
| Hover over boxplot or outliers for additional information |
| Chart generated 01/12/2024 |
| - Barium, UNF, ICP-MS - |
| Lab: NWQL, PCode: 01007, MCode: PLM78 |
| Analysis Dates: 05/12/15 through 09/27/23 |
| Open Data Set |
| Boxplot Description |
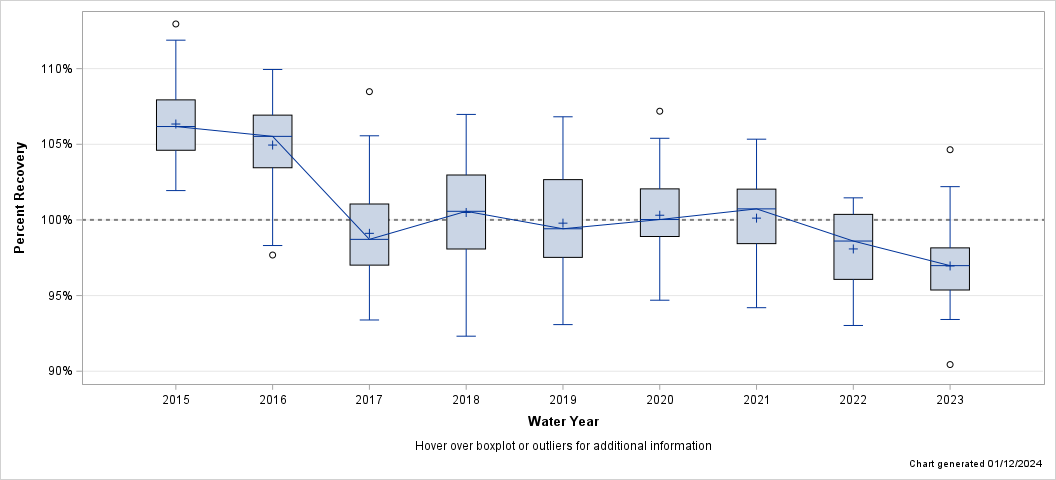
| Percent Recovery Statistics for Barium, UNF, ICP-MS |
| Analyte | Parm-meth Code | Water Year | # of Samples |
25th Pctl | 50th Pctl (Median) |
75th Pctl |
|---|---|---|---|---|---|---|
| Barium, UNF, ICP-MS | 01007PLM78 | 2015 | 21 | 104.6% | 106.2% | 107.9% |
| 2016 | 47 | 103.4% | 105.5% | 106.9% | ||
| 2017 | 48 | 97.0% | 98.7% | 101.1% | ||
| 2018 | 48 | 98.1% | 100.6% | 103.0% | ||
| 2019 | 41 | 97.5% | 99.4% | 102.7% | ||
| 2020 | 44 | 98.9% | 100.0% | 102.1% | ||
| 2021 | 48 | 98.4% | 100.7% | 102.0% | ||
| 2022 | 46 | 96.1% | 98.6% | 100.4% | ||
| 2023 | 44 | 95.4% | 97.0% | 98.2% |
| Hover over boxplot or outliers for additional information |
| Chart generated 01/12/2024 |
| - Barium, UNF, ICP-OES - |
| Lab: NWQL, PCode: 01007, MCode: PLA15 |
| Analysis Dates: 11/21/08 through 03/24/15 |
| Open Data Set |
| Boxplot Description |
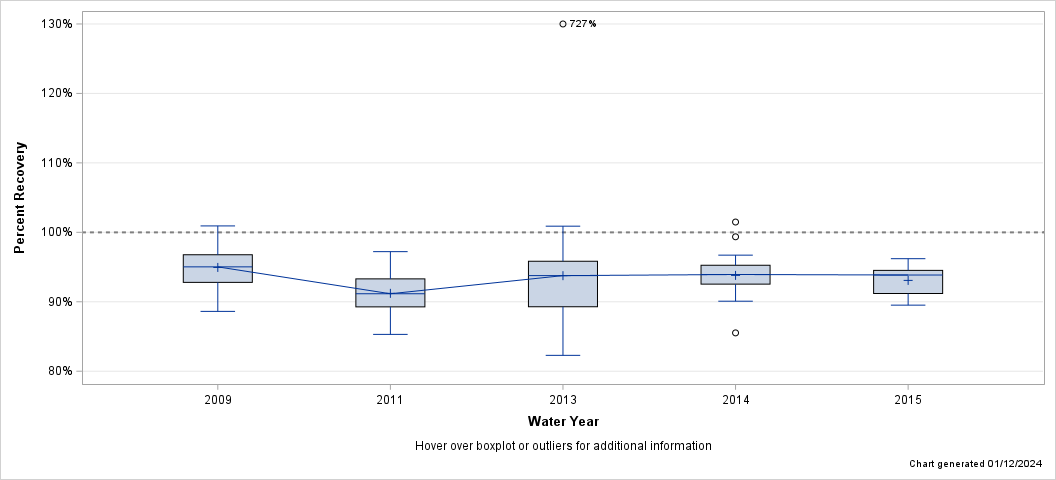
| Percent Recovery Statistics for Barium, UNF, ICP-OES |
| Analyte | Parm-meth Code | Water Year | # of Samples |
25th Pctl | 50th Pctl (Median) |
75th Pctl |
|---|---|---|---|---|---|---|
| Barium, UNF, ICP-OES | 01007PLA15 | 2009 | 34 | 92.8% | 95.0% | 96.8% |
| 2011 | 40 | 89.3% | 91.2% | 93.3% | ||
| 2013 | 42 | 89.3% | 93.8% | 95.8% | ||
| 2014 | 46 | 92.5% | 93.9% | 95.3% | ||
| 2015 | 16 | 91.2% | 93.9% | 94.5% |
| Hover over boxplot or outliers for additional information |
| Chart generated 01/12/2024 |
| - Barium, UNF, ICP-OES - |
| Lab: NWQL, PCode: 01007, MCode: PLO07 |
| Analysis Dates: 05/28/15 through 12/03/16 |
| Open Data Set |
| Boxplot Description |
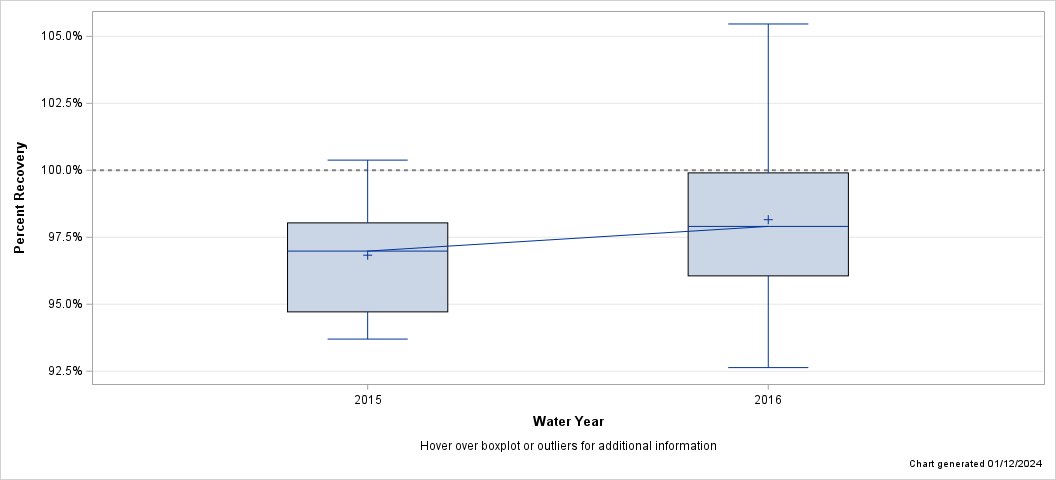
| Percent Recovery Statistics for Barium, UNF, ICP-OES |
| Analyte | Parm-meth Code | Water Year | # of Samples |
25th Pctl | 50th Pctl (Median) |
75th Pctl |
|---|---|---|---|---|---|---|
| Barium, UNF, ICP-OES | 01007PLO07 | 2015 | 26 | 94.7% | 97.0% | 98.0% |
| 2016 | 41 | 96.1% | 97.9% | 99.9% |
| Hover over boxplot or outliers for additional information |
| Chart generated 01/12/2024 |
| - Beryllium, FIL, ICP-MS - |
| Lab: NWQL, PCode: 01010, MCode: PLM43 |
| Analysis Dates: 10/01/08 through 09/01/23 |
| Open Data Set |
| Boxplot Description |
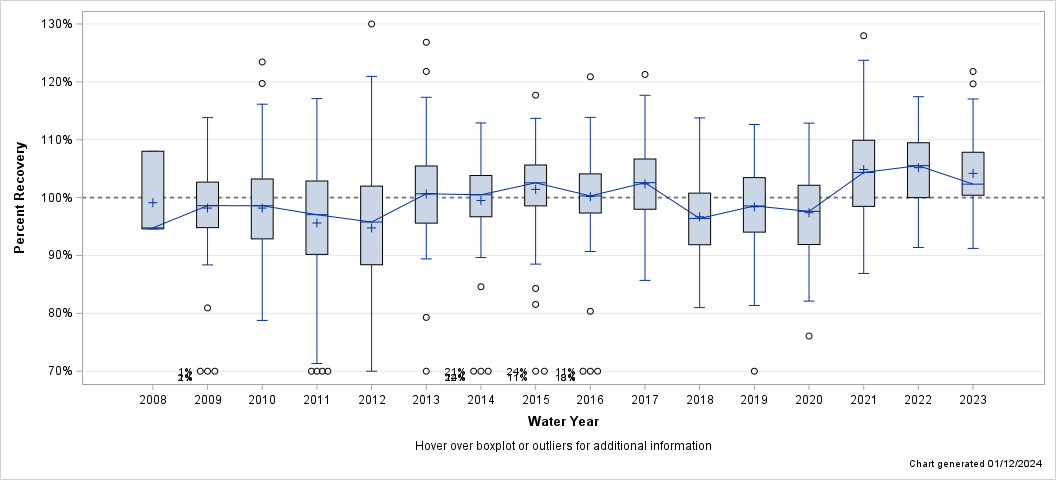
| Percent Recovery Statistics for Beryllium, FIL, ICP-MS |
| Analyte | Parm-meth Code | Water Year | # of Samples |
25th Pctl | 50th Pctl (Median) |
75th Pctl |
|---|---|---|---|---|---|---|
| Beryllium, FIL, ICP-MS | 01010PLM43 | 2008 | 3 | 94.6% | 94.8% | 108.0% |
| 2009 | 105 | 94.8% | 98.6% | 102.7% | ||
| 2010 | 132 | 92.9% | 98.6% | 103.2% | ||
| 2011 | 131 | 90.2% | 97.1% | 102.9% | ||
| 2012 | 132 | 88.4% | 95.8% | 102.0% | ||
| 2013 | 108 | 95.6% | 100.7% | 105.5% | ||
| 2014 | 83 | 96.7% | 100.5% | 103.8% | ||
| 2015 | 90 | 98.6% | 102.6% | 105.6% | ||
| 2016 | 90 | 97.3% | 100.3% | 104.1% | ||
| 2017 | 90 | 98.0% | 102.6% | 106.7% | ||
| 2018 | 90 | 91.9% | 96.4% | 100.8% | ||
| 2019 | 80 | 94.0% | 98.6% | 103.4% | ||
| 2020 | 85 | 91.9% | 97.6% | 102.1% | ||
| 2021 | 90 | 98.5% | 104.3% | 109.9% | ||
| 2022 | 88 | 100.0% | 105.5% | 109.5% | ||
| 2023 | 75 | 100.4% | 102.3% | 107.8% |
| Hover over boxplot or outliers for additional information |
| Chart generated 01/12/2024 |
| - Beryllium, UNF, ICP-MS - |
| Lab: NWQL, PCode: 01012, MCode: PLM47 |
| Analysis Dates: 10/16/08 through 04/30/15 |
| Open Data Set |
| Boxplot Description |
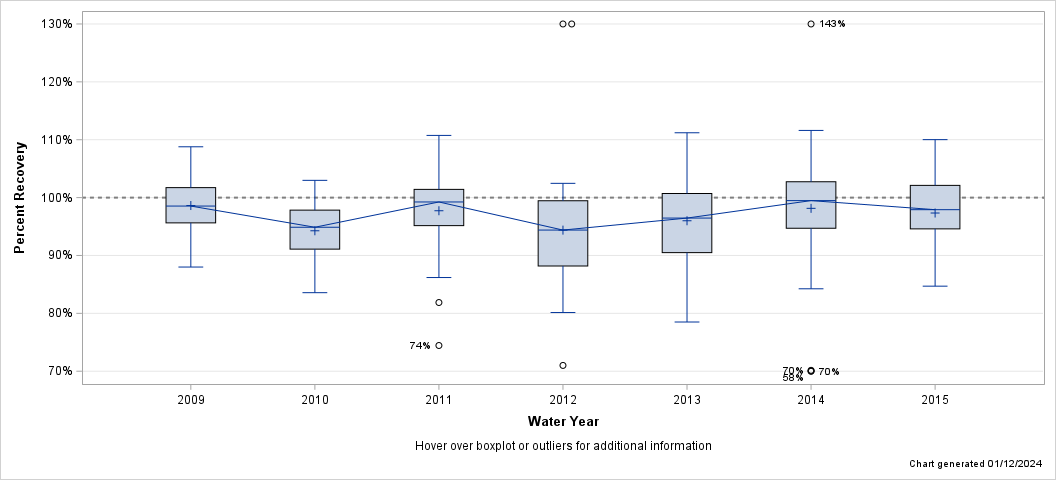
| Percent Recovery Statistics for Beryllium, UNF, ICP-MS |
| Analyte | Parm-meth Code | Water Year | # of Samples |
25th Pctl | 50th Pctl (Median) |
75th Pctl |
|---|---|---|---|---|---|---|
| Beryllium, UNF, ICP-MS | 01012PLM47 | 2009 | 65 | 95.6% | 98.5% | 101.7% |
| 2010 | 48 | 91.1% | 94.9% | 97.8% | ||
| 2011 | 48 | 95.2% | 99.2% | 101.4% | ||
| 2012 | 48 | 88.2% | 94.4% | 99.4% | ||
| 2013 | 48 | 90.5% | 96.5% | 100.7% | ||
| 2014 | 45 | 94.7% | 99.5% | 102.7% | ||
| 2015 | 27 | 94.6% | 97.9% | 102.1% |
| Hover over boxplot or outliers for additional information |
| Chart generated 01/12/2024 |
| - Beryllium, UNF, ICP-MS - |
| Lab: NWQL, PCode: 01012, MCode: PLM78 |
| Analysis Dates: 05/12/15 through 09/27/23 |
| Open Data Set |
| Boxplot Description |
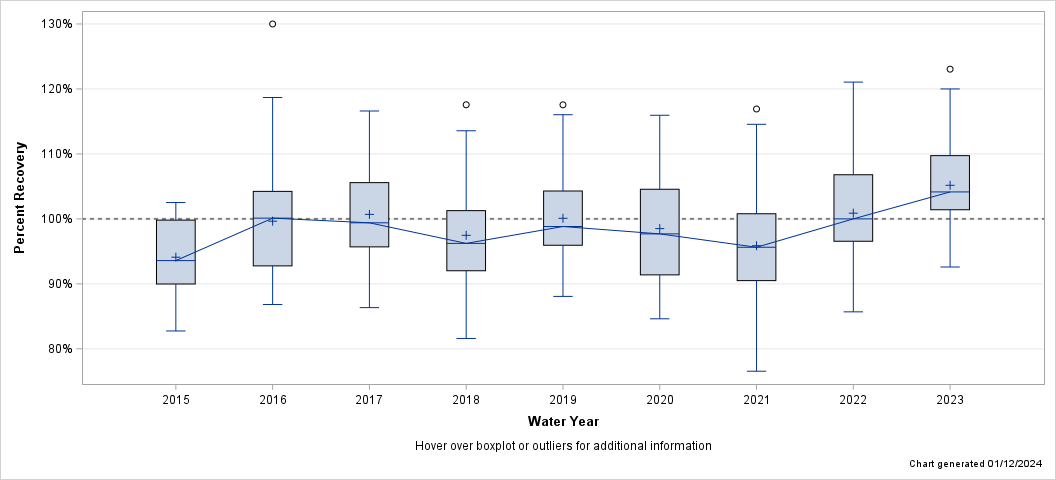
| Percent Recovery Statistics for Beryllium, UNF, ICP-MS |
| Analyte | Parm-meth Code | Water Year | # of Samples |
25th Pctl | 50th Pctl (Median) |
75th Pctl |
|---|---|---|---|---|---|---|
| Beryllium, UNF, ICP-MS | 01012PLM78 | 2015 | 21 | 90.0% | 93.6% | 99.8% |
| 2016 | 48 | 92.8% | 100.1% | 104.2% | ||
| 2017 | 48 | 95.7% | 99.4% | 105.6% | ||
| 2018 | 48 | 92.0% | 96.2% | 101.3% | ||
| 2019 | 41 | 95.9% | 98.8% | 104.3% | ||
| 2020 | 44 | 91.4% | 97.7% | 104.6% | ||
| 2021 | 48 | 90.5% | 95.6% | 100.8% | ||
| 2022 | 46 | 96.6% | 100.0% | 106.8% | ||
| 2023 | 44 | 101.4% | 104.1% | 109.7% |
| Hover over boxplot or outliers for additional information |
| Chart generated 01/12/2024 |
| - Beryllium, UNF, ICP-OES - |
| Lab: NWQL, PCode: 01012, MCode: PLA15 |
| Analysis Dates: 12/01/08 through 11/12/09 |
| Open Data Set |
| Boxplot Description |
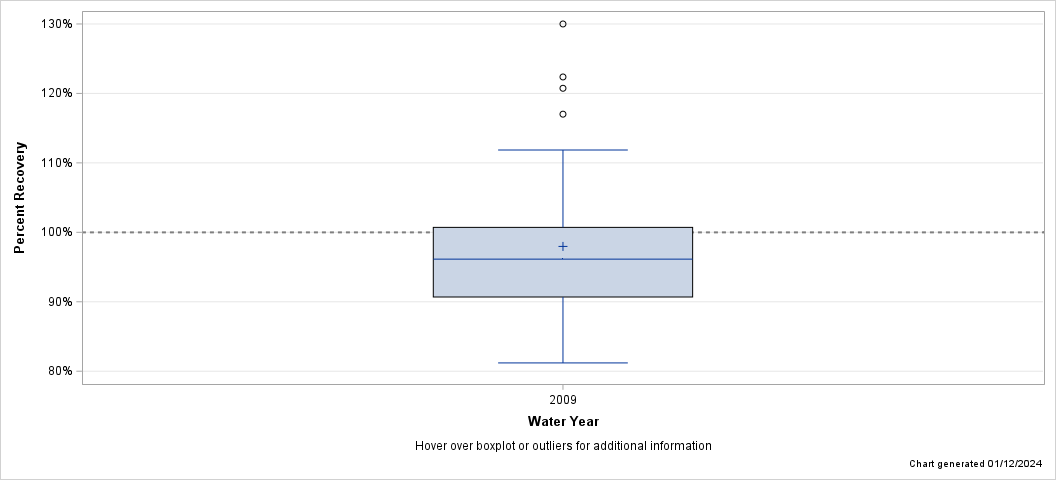
| Percent Recovery Statistics for Beryllium, UNF, ICP-OES |
| Analyte | Parm-meth Code | Water Year | # of Samples |
25th Pctl | 50th Pctl (Median) |
75th Pctl |
|---|---|---|---|---|---|---|
| Beryllium, UNF, ICP-OES | 01012PLA15 | 2009 | 32 | 90.7% | 96.1% | 100.7% |
| Hover over boxplot or outliers for additional information |
| Chart generated 01/12/2024 |
| - Boron, FIL, ICP-MS - |
| Lab: NWQL, PCode: 01020, MCode: PLM40 |
| Analysis Dates: 10/01/08 through 09/07/23 |
| Open Data Set |
| Boxplot Description |
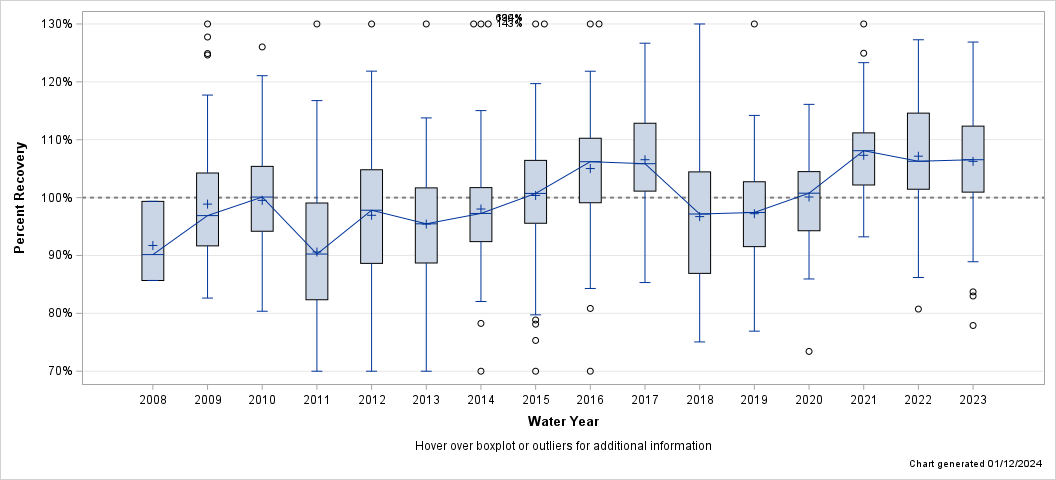
| Percent Recovery Statistics for Boron, FIL, ICP-MS |
| Analyte | Parm-meth Code | Water Year | # of Samples |
25th Pctl | 50th Pctl (Median) |
75th Pctl |
|---|---|---|---|---|---|---|
| Boron, FIL, ICP-MS | 01020PLM40 | 2008 | 3 | 85.7% | 90.1% | 99.4% |
| 2009 | 105 | 91.7% | 96.9% | 104.3% | ||
| 2010 | 132 | 94.2% | 100.1% | 105.4% | ||
| 2011 | 131 | 82.3% | 90.2% | 99.1% | ||
| 2012 | 132 | 88.6% | 97.8% | 104.8% | ||
| 2013 | 108 | 88.7% | 95.5% | 101.7% | ||
| 2014 | 83 | 92.4% | 97.3% | 101.7% | ||
| 2015 | 77 | 95.6% | 100.7% | 106.4% | ||
| 2016 | 77 | 99.1% | 106.2% | 110.3% | ||
| 2017 | 79 | 101.1% | 105.9% | 112.9% | ||
| 2018 | 76 | 86.9% | 97.2% | 104.5% | ||
| 2019 | 68 | 91.5% | 97.4% | 102.7% | ||
| 2020 | 71 | 94.3% | 100.8% | 104.5% | ||
| 2021 | 90 | 102.2% | 108.1% | 111.2% | ||
| 2022 | 88 | 101.4% | 106.3% | 114.6% | ||
| 2023 | 75 | 100.9% | 106.5% | 112.3% |
| Hover over boxplot or outliers for additional information |
| Chart generated 01/12/2024 |
| - Boron, FIL, ICP-OES - |
| Lab: NWQL, PCode: 01020, MCode: PLA13 |
| Analysis Dates: 10/04/08 through 09/28/23 |
| Open Data Set |
| Boxplot Description |
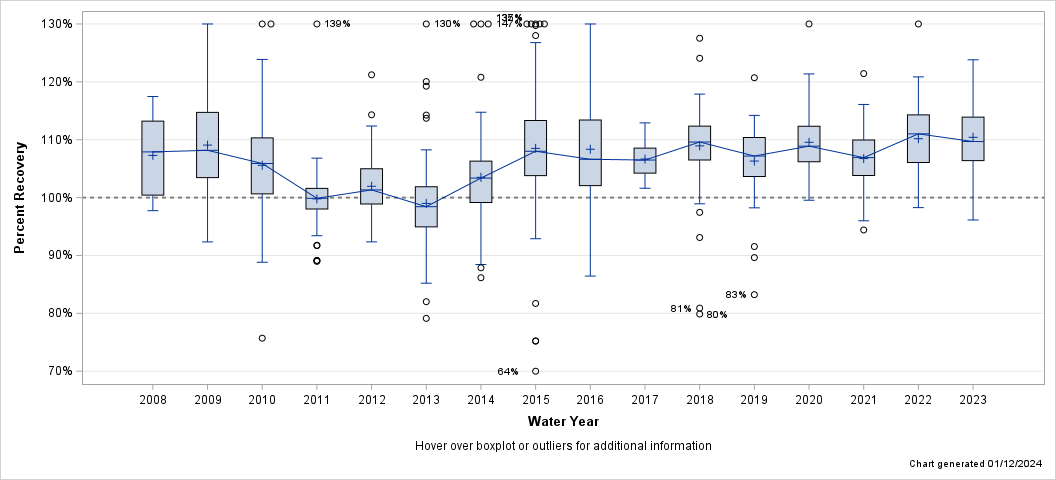
| Percent Recovery Statistics for Boron, FIL, ICP-OES |
| Analyte | Parm-meth Code | Water Year | # of Samples |
25th Pctl | 50th Pctl (Median) |
75th Pctl |
|---|---|---|---|---|---|---|
| Boron, FIL, ICP-OES | 01020PLA13 | 2008 | 7 | 100.4% | 107.9% | 113.2% |
| 2009 | 78 | 103.5% | 108.2% | 114.7% | ||
| 2010 | 96 | 100.6% | 105.9% | 110.3% | ||
| 2011 | 95 | 98.0% | 99.9% | 101.6% | ||
| 2012 | 110 | 98.9% | 101.3% | 105.0% | ||
| 2013 | 85 | 94.9% | 98.4% | 101.9% | ||
| 2014 | 85 | 99.1% | 103.4% | 106.3% | ||
| 2015 | 90 | 103.8% | 108.0% | 113.3% | ||
| 2016 | 42 | 102.1% | 106.6% | 113.4% | ||
| 2017 | 42 | 104.2% | 106.5% | 108.5% | ||
| 2018 | 80 | 106.5% | 109.6% | 112.4% | ||
| 2019 | 59 | 103.6% | 107.2% | 110.4% | ||
| 2020 | 59 | 106.2% | 108.9% | 112.3% | ||
| 2021 | 66 | 103.8% | 106.9% | 110.0% | ||
| 2022 | 65 | 106.1% | 111.0% | 114.3% | ||
| 2023 | 65 | 106.4% | 109.7% | 113.9% |
| Hover over boxplot or outliers for additional information |
| Chart generated 01/12/2024 |
| - Boron, UNF, ICP-MS - |
| Lab: NWQL, PCode: 01022, MCode: PLM47 |
| Analysis Dates: 10/16/08 through 04/30/15 |
| Open Data Set |
| Boxplot Description |
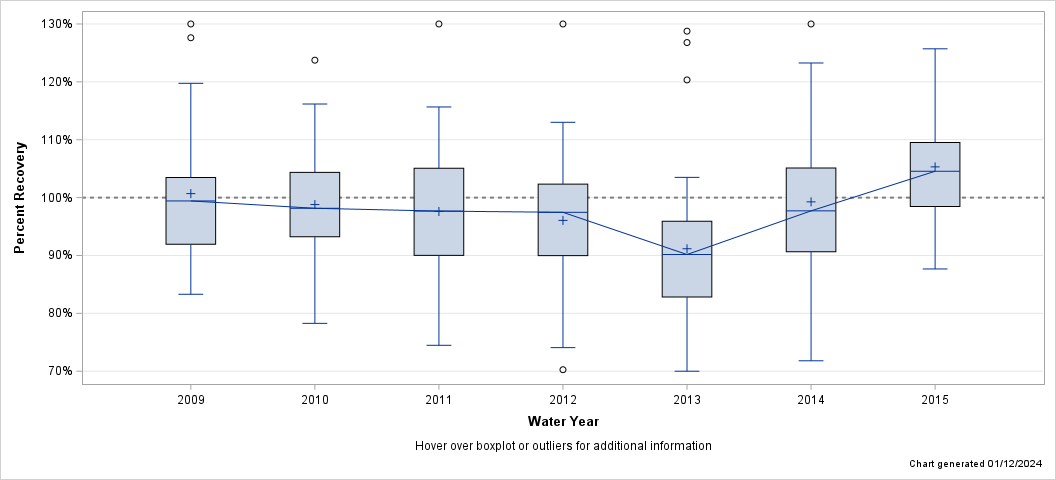
| Percent Recovery Statistics for Boron, UNF, ICP-MS |
| Analyte | Parm-meth Code | Water Year | # of Samples |
25th Pctl | 50th Pctl (Median) |
75th Pctl |
|---|---|---|---|---|---|---|
| Boron, UNF, ICP-MS | 01022PLM47 | 2009 | 39 | 91.9% | 99.4% | 103.5% |
| 2010 | 48 | 93.2% | 98.2% | 104.4% | ||
| 2011 | 48 | 90.0% | 97.7% | 105.1% | ||
| 2012 | 48 | 90.0% | 97.5% | 102.3% | ||
| 2013 | 25 | 82.8% | 90.2% | 95.9% | ||
| 2014 | 45 | 90.7% | 97.7% | 105.1% | ||
| 2015 | 23 | 98.5% | 104.5% | 109.5% |
| Hover over boxplot or outliers for additional information |
| Chart generated 01/12/2024 |
| - Boron, UNF, ICP-MS - |
| Lab: NWQL, PCode: 01022, MCode: PLM78 |
| Analysis Dates: 05/12/15 through 09/27/23 |
| Open Data Set |
| Boxplot Description |
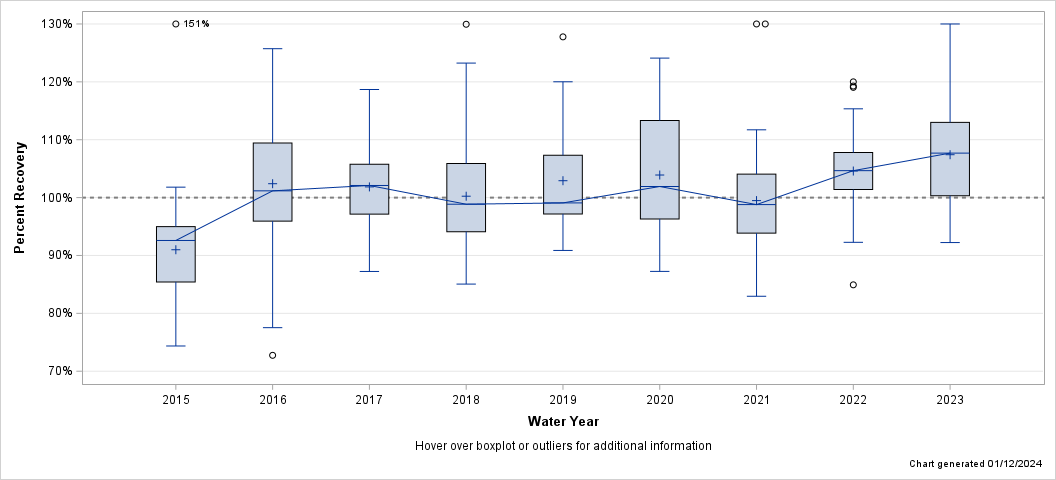
| Percent Recovery Statistics for Boron, UNF, ICP-MS |
| Analyte | Parm-meth Code | Water Year | # of Samples |
25th Pctl | 50th Pctl (Median) |
75th Pctl |
|---|---|---|---|---|---|---|
| Boron, UNF, ICP-MS | 01022PLM78 | 2015 | 17 | 85.4% | 92.6% | 95.0% |
| 2016 | 42 | 95.9% | 101.2% | 109.4% | ||
| 2017 | 41 | 97.1% | 102.1% | 105.8% | ||
| 2018 | 40 | 94.1% | 98.9% | 105.9% | ||
| 2019 | 33 | 97.2% | 99.1% | 107.3% | ||
| 2020 | 36 | 96.3% | 101.9% | 113.3% | ||
| 2021 | 48 | 93.9% | 98.8% | 104.1% | ||
| 2022 | 46 | 101.4% | 104.7% | 107.8% | ||
| 2023 | 44 | 100.3% | 107.7% | 113.0% |
| Hover over boxplot or outliers for additional information |
| Chart generated 01/12/2024 |
| - Boron, UNF, ICP-OES - |
| Lab: NWQL, PCode: 01022, MCode: PLA15 |
| Analysis Dates: 11/10/12 through 02/10/14 |
| Open Data Set |
| Boxplot Description |
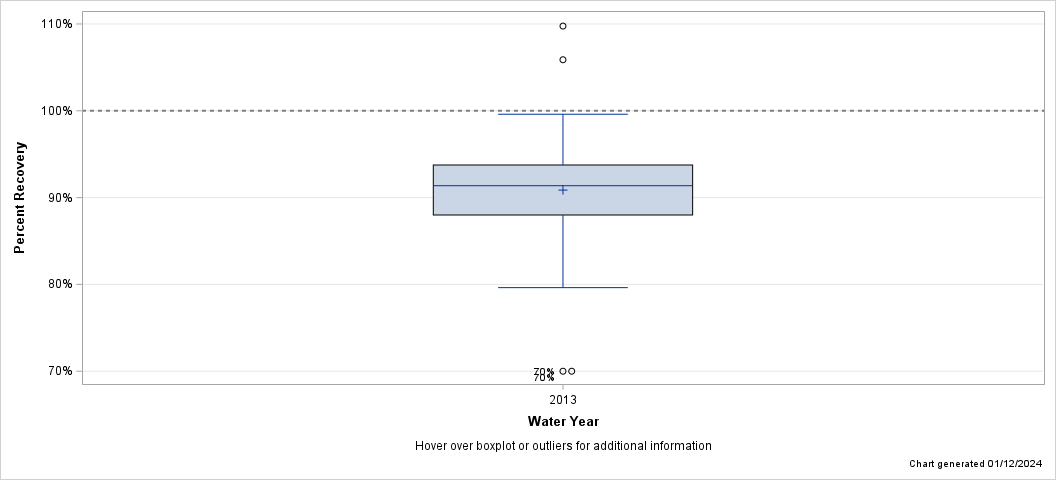
| Percent Recovery Statistics for Boron, UNF, ICP-OES |
| Analyte | Parm-meth Code | Water Year | # of Samples |
25th Pctl | 50th Pctl (Median) |
75th Pctl |
|---|---|---|---|---|---|---|
| Boron, UNF, ICP-OES | 01022PLA15 | 2013 | 42 | 88.0% | 91.4% | 93.8% |
| Hover over boxplot or outliers for additional information |
| Chart generated 01/12/2024 |
| - Cadmium, FIL, ICP-MS - |
| Lab: NWQL, PCode: 01025, MCode: PLM43 |
| Analysis Dates: 10/01/08 through 09/01/23 |
| Open Data Set |
| Boxplot Description |
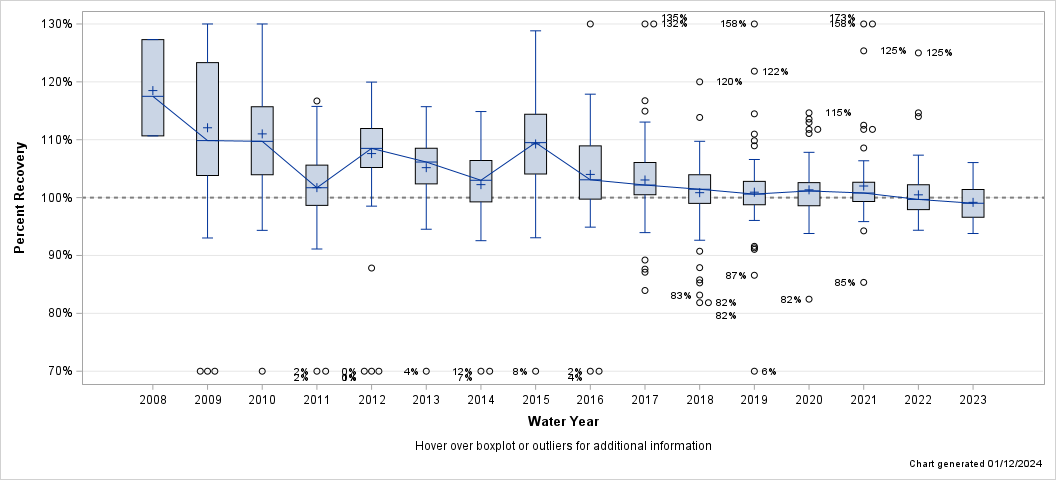
| Percent Recovery Statistics for Cadmium, FIL, ICP-MS |
| Analyte | Parm-meth Code | Water Year | # of Samples |
25th Pctl | 50th Pctl (Median) |
75th Pctl |
|---|---|---|---|---|---|---|
| Cadmium, FIL, ICP-MS | 01025PLM43 | 2008 | 3 | 110.7% | 117.5% | 127.3% |
| 2009 | 105 | 103.8% | 109.8% | 123.3% | ||
| 2010 | 132 | 103.9% | 109.7% | 115.7% | ||
| 2011 | 131 | 98.6% | 101.7% | 105.6% | ||
| 2012 | 132 | 105.2% | 108.5% | 111.9% | ||
| 2013 | 108 | 102.4% | 106.1% | 108.5% | ||
| 2014 | 69 | 99.3% | 103.0% | 106.4% | ||
| 2015 | 76 | 104.1% | 109.5% | 114.4% | ||
| 2016 | 75 | 99.7% | 103.1% | 108.9% | ||
| 2017 | 90 | 100.5% | 102.2% | 106.1% | ||
| 2018 | 90 | 99.0% | 101.4% | 103.9% | ||
| 2019 | 80 | 98.8% | 100.6% | 102.8% | ||
| 2020 | 75 | 98.6% | 101.2% | 102.6% | ||
| 2021 | 81 | 99.3% | 100.8% | 102.6% | ||
| 2022 | 74 | 97.9% | 99.7% | 102.2% | ||
| 2023 | 75 | 96.6% | 99.0% | 101.4% |
| Hover over boxplot or outliers for additional information |
| Chart generated 01/12/2024 |
| - Cadmium, UNF, ICP-MS - |
| Lab: NWQL, PCode: 01027, MCode: PLM47 |
| Analysis Dates: 10/01/08 through 04/30/15 |
| Open Data Set |
| Boxplot Description |
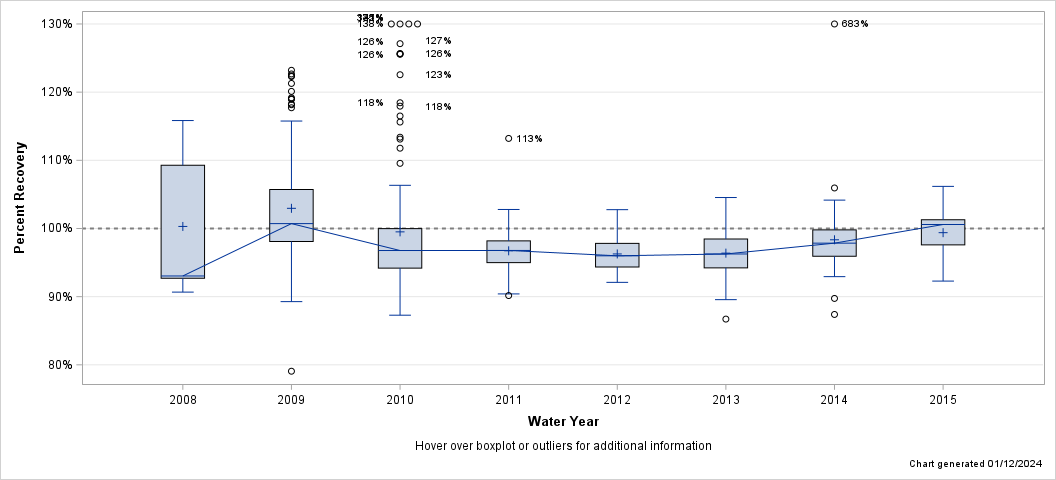
| Percent Recovery Statistics for Cadmium, UNF, ICP-MS |
| Analyte | Parm-meth Code | Water Year | # of Samples |
25th Pctl | 50th Pctl (Median) |
75th Pctl |
|---|---|---|---|---|---|---|
| Cadmium, UNF, ICP-MS | 01027PLM47 | 2008 | 5 | 92.7% | 93.0% | 109.3% |
| 2009 | 103 | 98.1% | 100.7% | 105.7% | ||
| 2010 | 131 | 94.2% | 96.8% | 100.0% | ||
| 2011 | 130 | 95.0% | 96.8% | 98.2% | ||
| 2012 | 83 | 94.4% | 96.0% | 97.8% | ||
| 2013 | 108 | 94.2% | 96.3% | 98.5% | ||
| 2014 | 70 | 95.9% | 97.8% | 99.8% | ||
| 2015 | 26 | 97.6% | 100.6% | 101.3% |
| Hover over boxplot or outliers for additional information |
| Chart generated 01/12/2024 |
| - Cadmium, UNF, ICP-MS - |
| Lab: NWQL, PCode: 01027, MCode: PLM78 |
| Analysis Dates: 05/12/15 through 09/27/23 |
| Open Data Set |
| Boxplot Description |
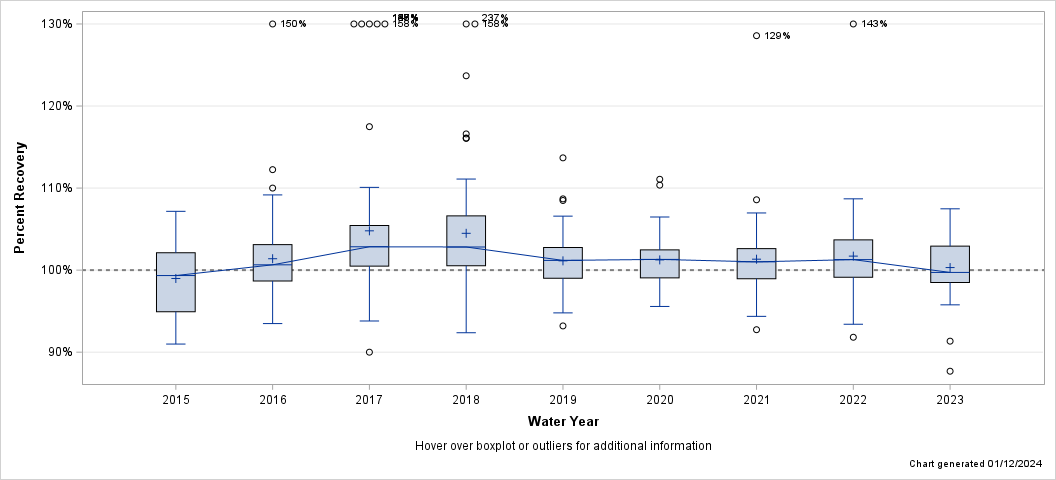
| Percent Recovery Statistics for Cadmium, UNF, ICP-MS |
| Analyte | Parm-meth Code | Water Year | # of Samples |
25th Pctl | 50th Pctl (Median) |
75th Pctl |
|---|---|---|---|---|---|---|
| Cadmium, UNF, ICP-MS | 01027PLM78 | 2015 | 30 | 94.9% | 99.3% | 102.1% |
| 2016 | 55 | 98.7% | 100.6% | 103.1% | ||
| 2017 | 66 | 100.5% | 102.8% | 105.4% | ||
| 2018 | 66 | 100.5% | 102.8% | 106.6% | ||
| 2019 | 56 | 99.0% | 101.2% | 102.8% | ||
| 2020 | 39 | 99.1% | 101.3% | 102.5% | ||
| 2021 | 42 | 98.9% | 101.0% | 102.6% | ||
| 2022 | 40 | 99.1% | 101.3% | 103.7% | ||
| 2023 | 44 | 98.5% | 99.7% | 102.9% |
| Hover over boxplot or outliers for additional information |
| Chart generated 01/12/2024 |
| - Chromium, FIL, ICP-OES - |
| Lab: NWQL, PCode: 01030, MCode: PLA11 |
| Analysis Dates: 12/04/08 through 07/08/14 |
| Open Data Set |
| Boxplot Description |
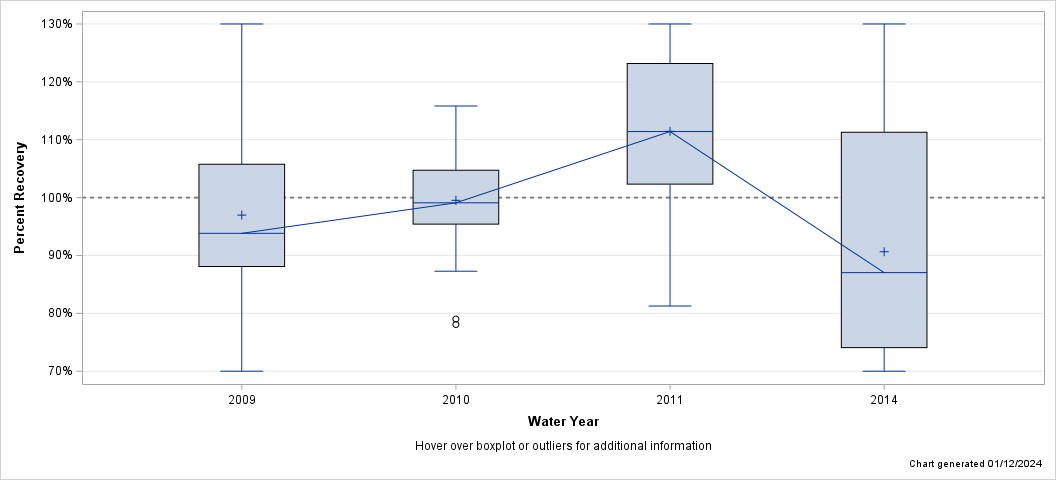
| Percent Recovery Statistics for Chromium, FIL, ICP-OES |
| Analyte | Parm-meth Code | Water Year | # of Samples |
25th Pctl | 50th Pctl (Median) |
75th Pctl |
|---|---|---|---|---|---|---|
| Chromium, FIL, ICP-OES | 01030PLA11 | 2009 | 31 | 88.1% | 93.8% | 105.8% |
| 2010 | 42 | 95.4% | 99.1% | 104.7% | ||
| 2011 | 40 | 102.3% | 111.4% | 123.2% | ||
| 2014 | 15 | 74.1% | 87.0% | 111.3% |
| Hover over boxplot or outliers for additional information |
| Chart generated 01/12/2024 |
| - Chromium, FIL, cICP-MS - |
| Lab: NWQL, PCode: 01030, MCode: PLM10 |
| Analysis Dates: 10/01/08 through 09/01/23 |
| Open Data Set |
| Boxplot Description |
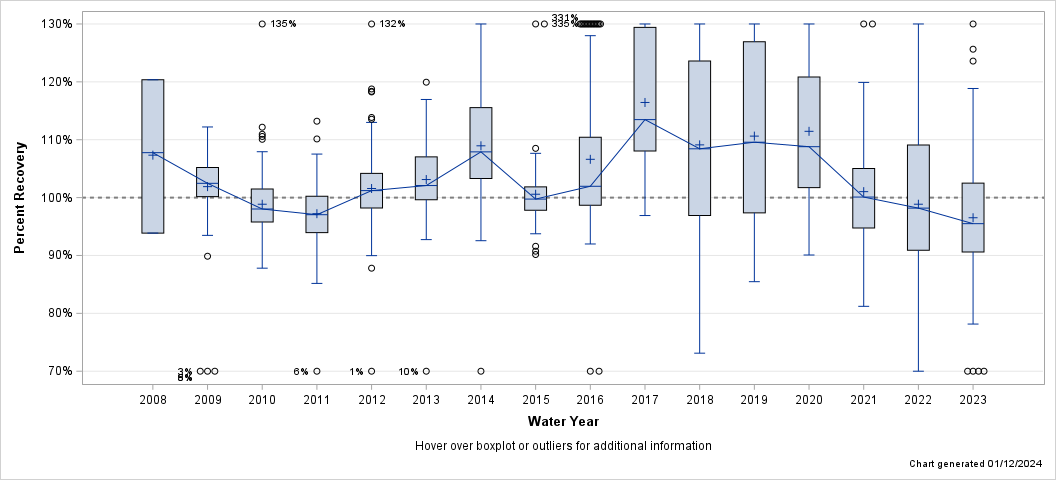
| Percent Recovery Statistics for Chromium, FIL, cICP-MS |
| Analyte | Parm-meth Code | Water Year | # of Samples |
25th Pctl | 50th Pctl (Median) |
75th Pctl |
|---|---|---|---|---|---|---|
| Chromium, FIL, cICP-MS | 01030PLM10 | 2008 | 3 | 93.9% | 107.8% | 120.4% |
| 2009 | 105 | 100.2% | 102.5% | 105.2% | ||
| 2010 | 132 | 95.8% | 98.0% | 101.5% | ||
| 2011 | 131 | 93.9% | 97.0% | 100.2% | ||
| 2012 | 132 | 98.2% | 101.2% | 104.2% | ||
| 2013 | 108 | 99.6% | 102.1% | 107.0% | ||
| 2014 | 60 | 103.3% | 107.9% | 115.5% | ||
| 2015 | 77 | 97.8% | 99.7% | 101.8% | ||
| 2016 | 76 | 98.7% | 102.0% | 110.4% | ||
| 2017 | 86 | 108.0% | 113.5% | 129.4% | ||
| 2018 | 71 | 96.9% | 108.4% | 123.6% | ||
| 2019 | 64 | 97.4% | 109.6% | 126.9% | ||
| 2020 | 66 | 101.7% | 108.8% | 120.8% | ||
| 2021 | 78 | 94.7% | 100.1% | 105.0% | ||
| 2022 | 74 | 90.9% | 98.2% | 109.1% | ||
| 2023 | 65 | 90.6% | 95.5% | 102.5% |
| Hover over boxplot or outliers for additional information |
| Chart generated 01/12/2024 |
| - Chromium, UNF, ICP-OES - |
| Lab: NWQL, PCode: 01034, MCode: PLA15 |
| Analysis Dates: 12/01/08 through 07/29/14 |
| Open Data Set |
| Boxplot Description |
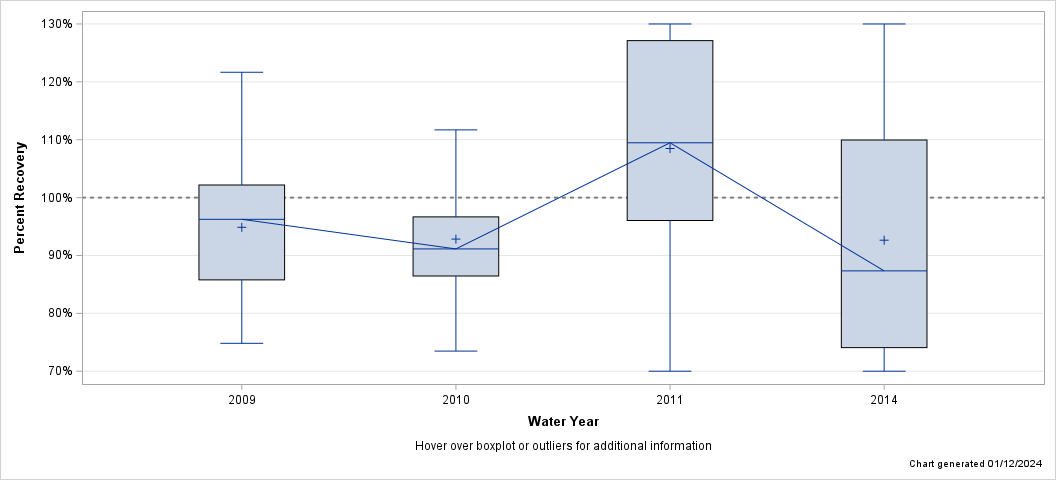
| Percent Recovery Statistics for Chromium, UNF, ICP-OES |
| Analyte | Parm-meth Code | Water Year | # of Samples |
25th Pctl | 50th Pctl (Median) |
75th Pctl |
|---|---|---|---|---|---|---|
| Chromium, UNF, ICP-OES | 01034PLA15 | 2009 | 31 | 85.8% | 96.2% | 102.2% |
| 2010 | 42 | 86.5% | 91.1% | 96.7% | ||
| 2011 | 40 | 96.1% | 109.5% | 127.8% | ||
| 2014 | 14 | 74.1% | 87.3% | 110.0% |
| Hover over boxplot or outliers for additional information |
| Chart generated 01/12/2024 |
| - Chromium, UNF, ICP-OES - |
| Lab: NWQL, PCode: 01034, MCode: PLO07 |
| Analysis Dates: 11/08/19 through 09/20/23 |
| Open Data Set |
| Boxplot Description |
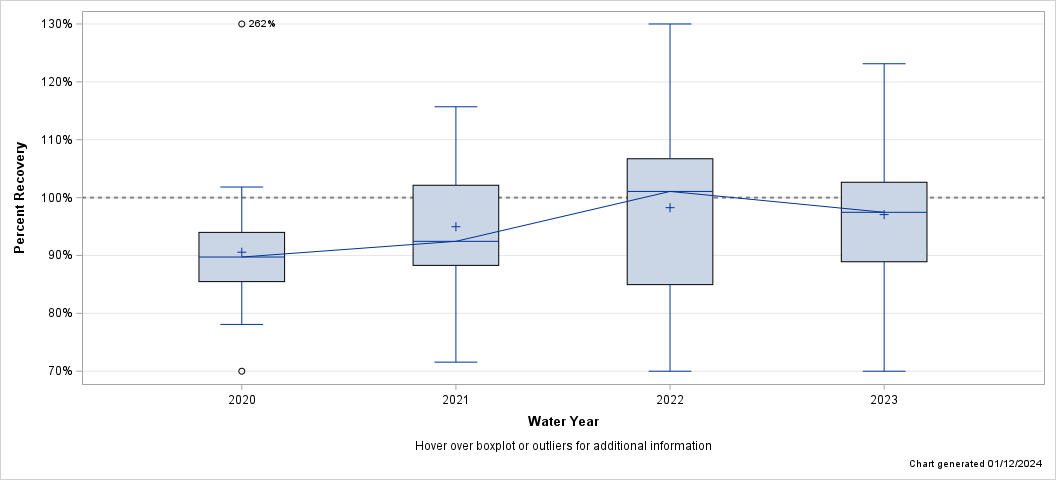
| Percent Recovery Statistics for Chromium, UNF, ICP-OES |
| Analyte | Parm-meth Code | Water Year | # of Samples |
25th Pctl | 50th Pctl (Median) |
75th Pctl |
|---|---|---|---|---|---|---|
| Chromium, UNF, ICP-OES | 01034PLO07 | 2020 | 17 | 85.5% | 89.7% | 94.0% |
| 2021 | 20 | 88.3% | 92.4% | 102.1% | ||
| 2022 | 18 | 85.0% | 101.1% | 106.7% | ||
| 2023 | 15 | 88.9% | 97.5% | 102.6% |
| Hover over boxplot or outliers for additional information |
| Chart generated 01/12/2024 |
| - Chromium, UNF, cICP-MS - |
| Lab: NWQL, PCode: 01034, MCode: PLM11 |
| Analysis Dates: 10/06/08 through 04/22/15 |
| Open Data Set |
| Boxplot Description |
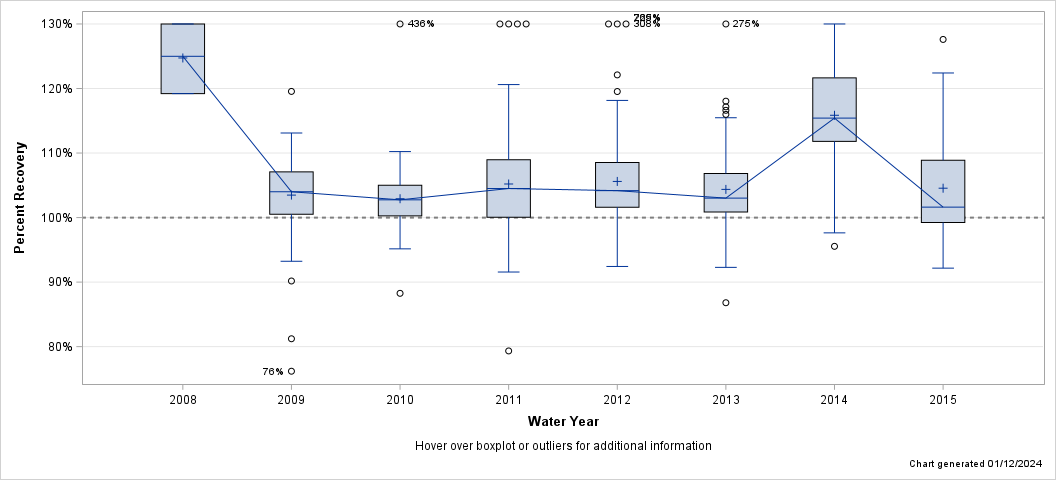
| Percent Recovery Statistics for Chromium, UNF, cICP-MS |
| Analyte | Parm-meth Code | Water Year | # of Samples |
25th Pctl | 50th Pctl (Median) |
75th Pctl |
|---|---|---|---|---|---|---|
| Chromium, UNF, cICP-MS | 01034PLM11 | 2008 | 3 | 119.2% | 125.0% | 135.4% |
| 2009 | 103 | 100.5% | 104.0% | 107.1% | ||
| 2010 | 84 | 100.3% | 102.7% | 105.0% | ||
| 2011 | 83 | 100.1% | 104.5% | 109.0% | ||
| 2012 | 82 | 101.6% | 104.2% | 108.5% | ||
| 2013 | 48 | 100.9% | 103.0% | 106.8% | ||
| 2014 | 33 | 111.8% | 115.4% | 121.6% | ||
| 2015 | 21 | 99.2% | 101.6% | 108.9% |
| Hover over boxplot or outliers for additional information |
| Chart generated 01/12/2024 |
| - Chromium, UNF, cICP-MS - |
| Lab: NWQL, PCode: 01034, MCode: PLM77 |
| Analysis Dates: 05/12/15 through 09/27/23 |
| Open Data Set |
| Boxplot Description |
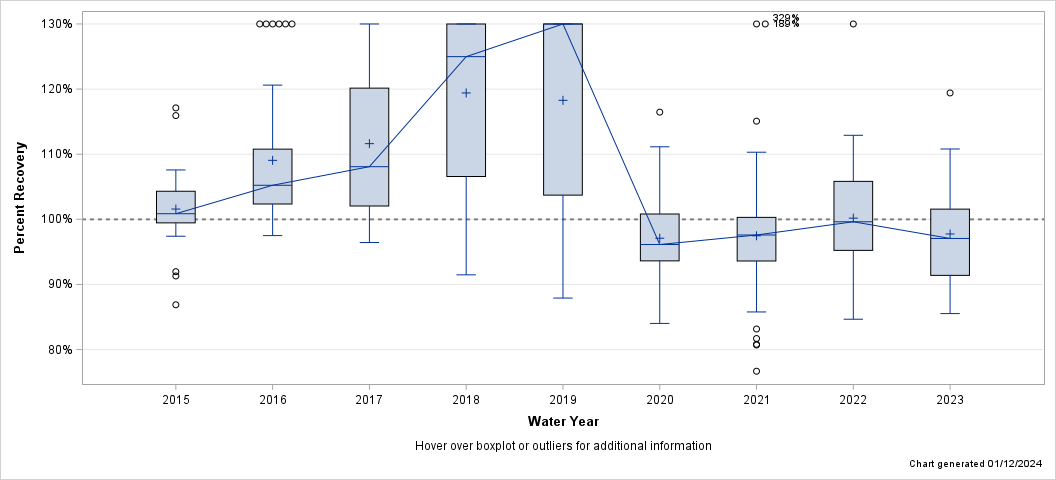
| Percent Recovery Statistics for Chromium, UNF, cICP-MS |
| Analyte | Parm-meth Code | Water Year | # of Samples |
25th Pctl | 50th Pctl (Median) |
75th Pctl |
|---|---|---|---|---|---|---|
| Chromium, UNF, cICP-MS | 01034PLM77 | 2015 | 21 | 99.5% | 100.9% | 104.3% |
| 2016 | 38 | 102.4% | 105.2% | 110.8% | ||
| 2017 | 45 | 102.1% | 108.1% | 120.2% | ||
| 2018 | 41 | 106.6% | 125.0% | 155.5% | ||
| 2019 | 32 | 103.7% | 135.1% | 159.7% | ||
| 2020 | 30 | 93.6% | 96.1% | 100.8% | ||
| 2021 | 42 | 93.6% | 97.6% | 100.3% | ||
| 2022 | 38 | 95.2% | 99.6% | 105.8% | ||
| 2023 | 36 | 91.4% | 97.1% | 101.6% |
| Hover over boxplot or outliers for additional information |
| Chart generated 01/12/2024 |
| - Cobalt, FIL, cICP-MS - |
| Lab: NWQL, PCode: 01035, MCode: PLM10 |
| Analysis Dates: 10/16/08 through 09/01/23 |
| Open Data Set |
| Boxplot Description |
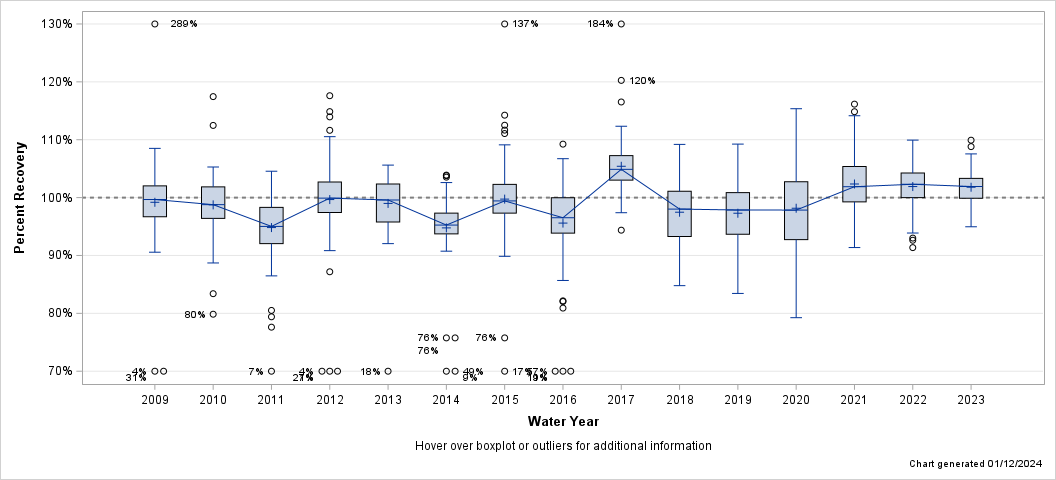
| Percent Recovery Statistics for Cobalt, FIL, cICP-MS |
| Analyte | Parm-meth Code | Water Year | # of Samples |
25th Pctl | 50th Pctl (Median) |
75th Pctl |
|---|---|---|---|---|---|---|
| Cobalt, FIL, cICP-MS | 01035PLM10 | 2009 | 105 | 96.7% | 99.7% | 102.0% |
| 2010 | 132 | 96.4% | 98.8% | 101.9% | ||
| 2011 | 131 | 92.0% | 95.0% | 98.3% | ||
| 2012 | 132 | 97.4% | 99.9% | 102.7% | ||
| 2013 | 108 | 95.8% | 99.6% | 102.4% | ||
| 2014 | 83 | 93.7% | 95.3% | 97.3% | ||
| 2015 | 90 | 97.3% | 99.4% | 102.3% | ||
| 2016 | 90 | 93.9% | 96.5% | 100.0% | ||
| 2017 | 90 | 103.0% | 104.9% | 107.3% | ||
| 2018 | 90 | 93.3% | 98.0% | 101.1% | ||
| 2019 | 80 | 93.7% | 97.9% | 100.9% | ||
| 2020 | 85 | 92.7% | 97.8% | 102.7% | ||
| 2021 | 90 | 99.3% | 101.9% | 105.4% | ||
| 2022 | 88 | 100.0% | 102.3% | 104.2% | ||
| 2023 | 75 | 99.9% | 101.9% | 103.3% |
| Hover over boxplot or outliers for additional information |
| Chart generated 01/12/2024 |
| - Cobalt, UNF, cICP-MS - |
| Lab: NWQL, PCode: 01037, MCode: PLM11 |
| Analysis Dates: 10/15/08 through 04/30/15 |
| Open Data Set |
| Boxplot Description |
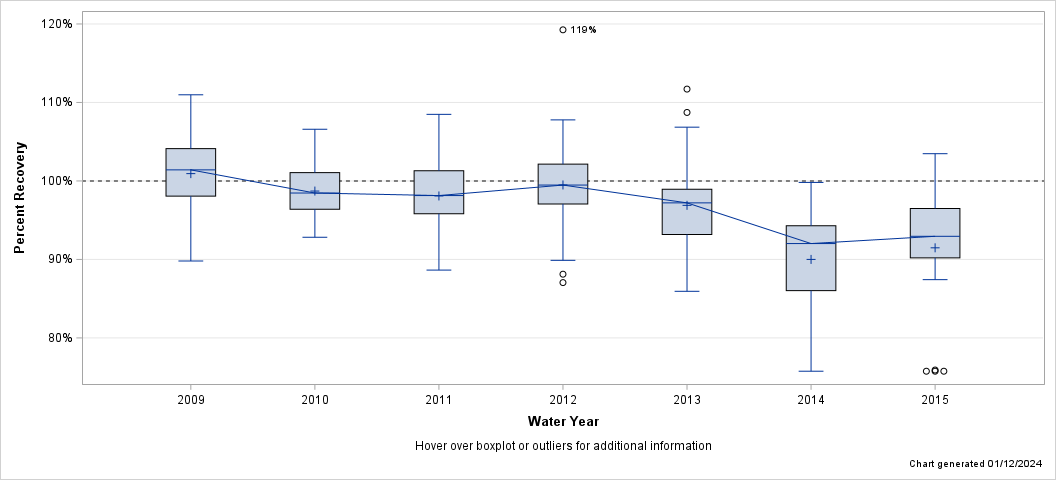
| Percent Recovery Statistics for Cobalt, UNF, cICP-MS |
| Analyte | Parm-meth Code | Water Year | # of Samples |
25th Pctl | 50th Pctl (Median) |
75th Pctl |
|---|---|---|---|---|---|---|
| Cobalt, UNF, cICP-MS | 01037PLM11 | 2009 | 39 | 98.1% | 101.4% | 104.1% |
| 2010 | 48 | 96.4% | 98.5% | 101.1% | ||
| 2011 | 48 | 95.8% | 98.1% | 101.3% | ||
| 2012 | 48 | 97.1% | 99.5% | 102.1% | ||
| 2013 | 48 | 93.2% | 97.2% | 98.9% | ||
| 2014 | 45 | 86.0% | 92.0% | 94.3% | ||
| 2015 | 27 | 90.2% | 92.9% | 96.5% |
| Hover over boxplot or outliers for additional information |
| Chart generated 01/12/2024 |
| - Cobalt, UNF, cICP-MS - |
| Lab: NWQL, PCode: 01037, MCode: PLM77 |
| Analysis Dates: 05/12/15 through 09/27/23 |
| Open Data Set |
| Boxplot Description |
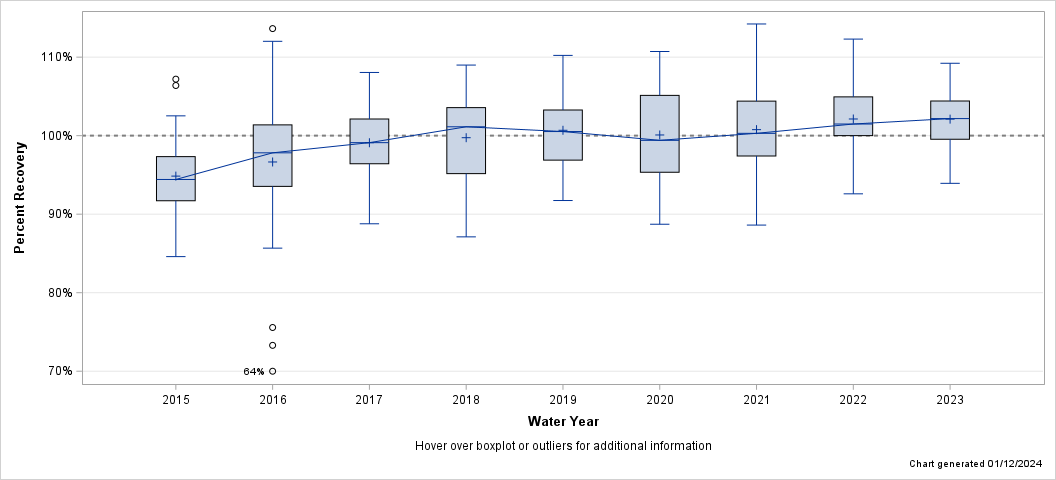
| Percent Recovery Statistics for Cobalt, UNF, cICP-MS |
| Analyte | Parm-meth Code | Water Year | # of Samples |
25th Pctl | 50th Pctl (Median) |
75th Pctl |
|---|---|---|---|---|---|---|
| Cobalt, UNF, cICP-MS | 01037PLM77 | 2015 | 21 | 91.7% | 94.4% | 97.3% |
| 2016 | 48 | 93.5% | 97.8% | 101.4% | ||
| 2017 | 48 | 96.4% | 99.1% | 102.1% | ||
| 2018 | 48 | 95.2% | 101.1% | 103.6% | ||
| 2019 | 41 | 96.9% | 100.5% | 103.3% | ||
| 2020 | 44 | 95.3% | 99.4% | 105.1% | ||
| 2021 | 48 | 97.4% | 100.3% | 104.4% | ||
| 2022 | 46 | 100.0% | 101.5% | 104.9% | ||
| 2023 | 44 | 99.5% | 102.2% | 104.4% |
| Hover over boxplot or outliers for additional information |
| Chart generated 01/12/2024 |
| - Copper, FIL, cICP-MS - |
| Lab: NWQL, PCode: 01040, MCode: PLM10 |
| Analysis Dates: 10/01/08 through 09/01/23 |
| Open Data Set |
| Boxplot Description |
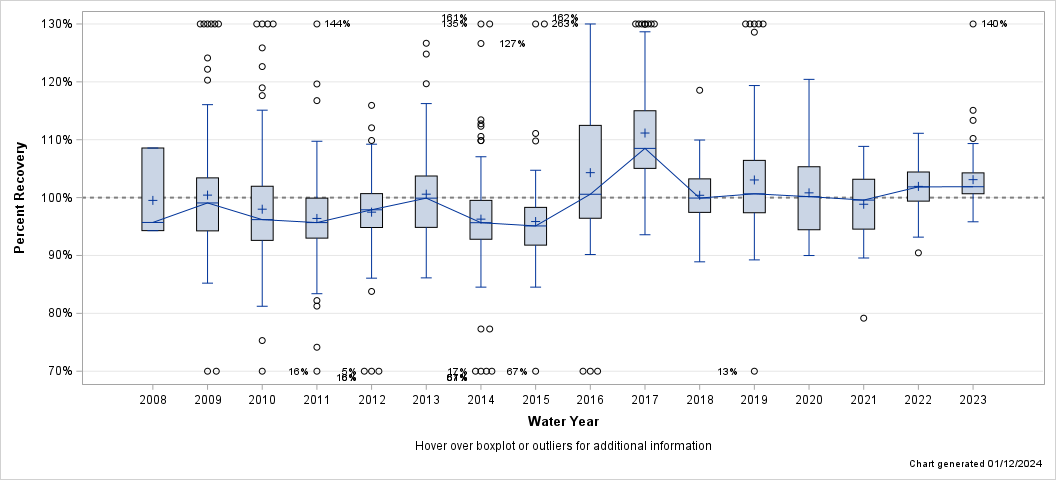
| Percent Recovery Statistics for Copper, FIL, cICP-MS |
| Analyte | Parm-meth Code | Water Year | # of Samples |
25th Pctl | 50th Pctl (Median) |
75th Pctl |
|---|---|---|---|---|---|---|
| Copper, FIL, cICP-MS | 01040PLM10 | 2008 | 3 | 94.3% | 95.7% | 108.6% |
| 2009 | 105 | 94.2% | 99.1% | 103.4% | ||
| 2010 | 132 | 92.6% | 96.2% | 102.0% | ||
| 2011 | 131 | 93.0% | 95.7% | 99.9% | ||
| 2012 | 132 | 94.8% | 97.9% | 100.7% | ||
| 2013 | 108 | 94.9% | 99.9% | 103.7% | ||
| 2014 | 83 | 92.8% | 95.7% | 99.5% | ||
| 2015 | 90 | 91.8% | 95.1% | 98.3% | ||
| 2016 | 84 | 96.4% | 100.6% | 112.5% | ||
| 2017 | 90 | 105.1% | 108.5% | 115.0% | ||
| 2018 | 90 | 97.4% | 99.9% | 103.2% | ||
| 2019 | 80 | 97.4% | 100.7% | 106.4% | ||
| 2020 | 85 | 94.5% | 100.2% | 105.3% | ||
| 2021 | 90 | 94.6% | 99.6% | 103.2% | ||
| 2022 | 88 | 99.4% | 101.9% | 104.4% | ||
| 2023 | 75 | 100.7% | 101.9% | 104.3% |
| Hover over boxplot or outliers for additional information |
| Chart generated 01/12/2024 |
| - Copper, UNF, cICP-MS - |
| Lab: NWQL, PCode: 01042, MCode: PLM11 |
| Analysis Dates: 10/06/08 through 04/30/15 |
| Open Data Set |
| Boxplot Description |
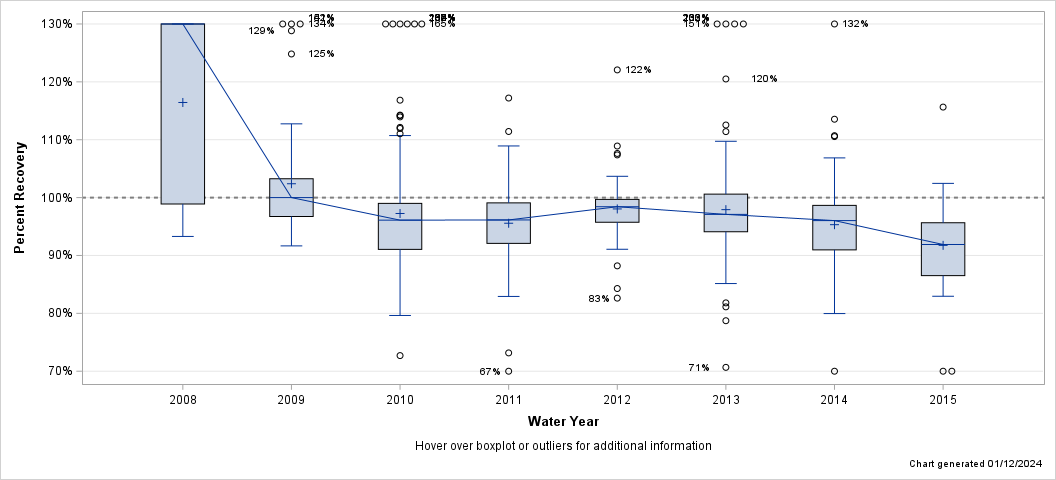
| Percent Recovery Statistics for Copper, UNF, cICP-MS |
| Analyte | Parm-meth Code | Water Year | # of Samples |
25th Pctl | 50th Pctl (Median) |
75th Pctl |
|---|---|---|---|---|---|---|
| Copper, UNF, cICP-MS | 01042PLM11 | 2008 | 5 | 98.9% | 130.2% | 157.6% |
| 2009 | 51 | 96.7% | 100.0% | 103.3% | ||
| 2010 | 131 | 91.1% | 96.1% | 99.0% | ||
| 2011 | 130 | 92.1% | 96.1% | 99.1% | ||
| 2012 | 83 | 95.7% | 98.4% | 99.7% | ||
| 2013 | 108 | 94.1% | 97.1% | 100.6% | ||
| 2014 | 83 | 91.0% | 96.0% | 98.7% | ||
| 2015 | 34 | 86.5% | 91.9% | 95.6% |
| Hover over boxplot or outliers for additional information |
| Chart generated 01/12/2024 |
| - Copper, UNF, cICP-MS - |
| Lab: NWQL, PCode: 01042, MCode: PLM77 |
| Analysis Dates: 05/12/15 through 09/27/23 |
| Open Data Set |
| Boxplot Description |
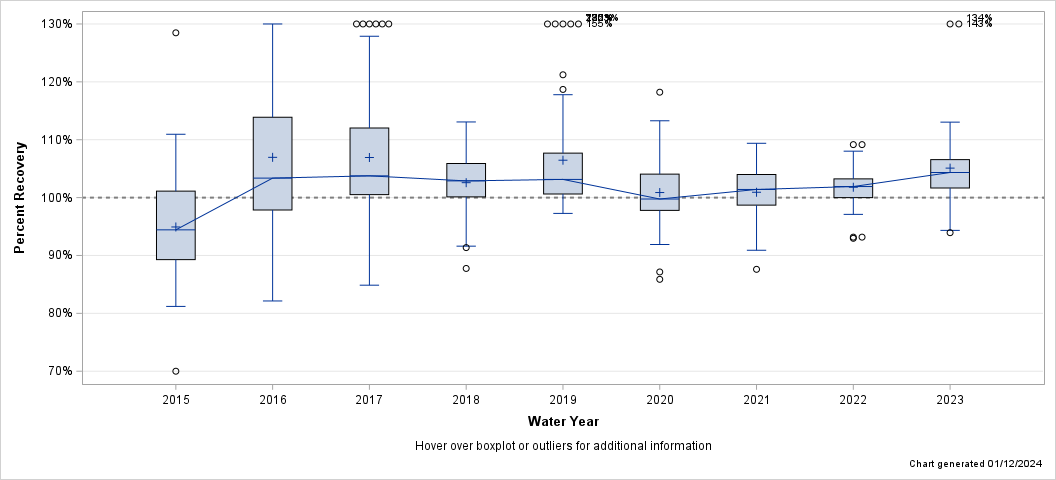
| Percent Recovery Statistics for Copper, UNF, cICP-MS |
| Analyte | Parm-meth Code | Water Year | # of Samples |
25th Pctl | 50th Pctl (Median) |
75th Pctl |
|---|---|---|---|---|---|---|
| Copper, UNF, cICP-MS | 01042PLM77 | 2015 | 32 | 89.3% | 94.4% | 101.1% |
| 2016 | 63 | 97.9% | 103.4% | 113.9% | ||
| 2017 | 66 | 100.5% | 103.8% | 112.0% | ||
| 2018 | 66 | 100.1% | 102.9% | 105.9% | ||
| 2019 | 56 | 100.6% | 103.1% | 107.7% | ||
| 2020 | 44 | 97.8% | 99.8% | 104.1% | ||
| 2021 | 48 | 98.7% | 101.4% | 104.0% | ||
| 2022 | 46 | 100.0% | 101.9% | 103.2% | ||
| 2023 | 44 | 101.6% | 104.3% | 106.6% |
| Hover over boxplot or outliers for additional information |
| Chart generated 01/12/2024 |
| - Iron, FIL, ICP-OES - |
| Lab: NWQL, PCode: 01046, MCode: PLA11 |
| Analysis Dates: 12/16/08 through 09/28/23 |
| Open Data Set |
| Boxplot Description |
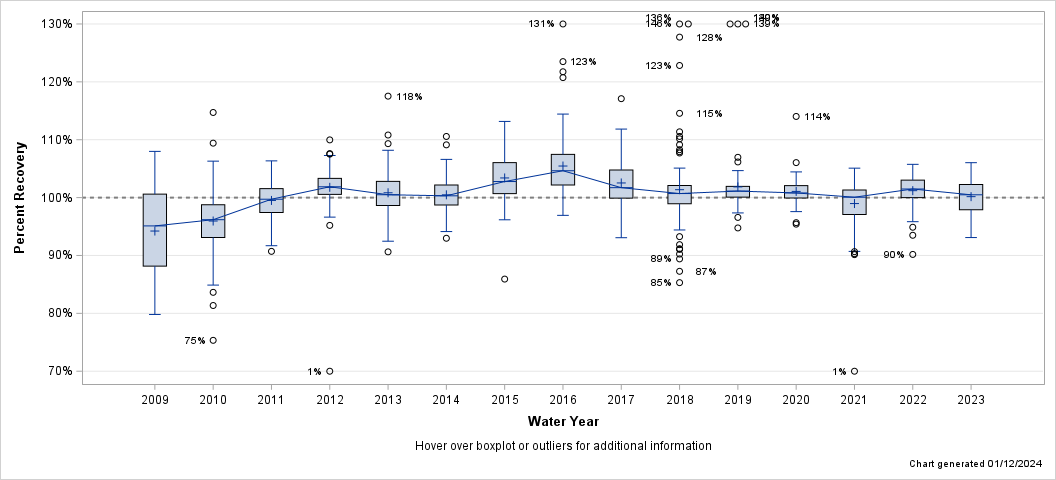
| Percent Recovery Statistics for Iron, FIL, ICP-OES |
| Analyte | Parm-meth Code | Water Year | # of Samples |
25th Pctl | 50th Pctl (Median) |
75th Pctl |
|---|---|---|---|---|---|---|
| Iron, FIL, ICP-OES | 01046PLA11 | 2009 | 24 | 88.2% | 95.1% | 100.6% |
| 2010 | 144 | 93.1% | 96.2% | 98.8% | ||
| 2011 | 143 | 97.4% | 99.7% | 101.5% | ||
| 2012 | 140 | 100.6% | 101.9% | 103.3% | ||
| 2013 | 121 | 98.6% | 100.5% | 102.8% | ||
| 2014 | 107 | 98.7% | 100.3% | 102.2% | ||
| 2015 | 114 | 100.7% | 102.8% | 106.0% | ||
| 2016 | 112 | 102.2% | 104.6% | 107.5% | ||
| 2017 | 108 | 99.9% | 101.7% | 104.8% | ||
| 2018 | 108 | 98.9% | 100.7% | 102.1% | ||
| 2019 | 98 | 100.1% | 101.1% | 101.9% | ||
| 2020 | 101 | 99.9% | 100.8% | 102.1% | ||
| 2021 | 107 | 97.1% | 100.1% | 101.3% | ||
| 2022 | 107 | 100.0% | 101.5% | 103.0% | ||
| 2023 | 107 | 97.9% | 100.5% | 102.3% |
| Hover over boxplot or outliers for additional information |
| Chart generated 01/12/2024 |
| - Iron, UNF, ICP-OES - |
| Lab: NWQL, PCode: 01045, MCode: PLA15 |
| Analysis Dates: 10/03/08 through 03/24/15 |
| Open Data Set |
| Boxplot Description |
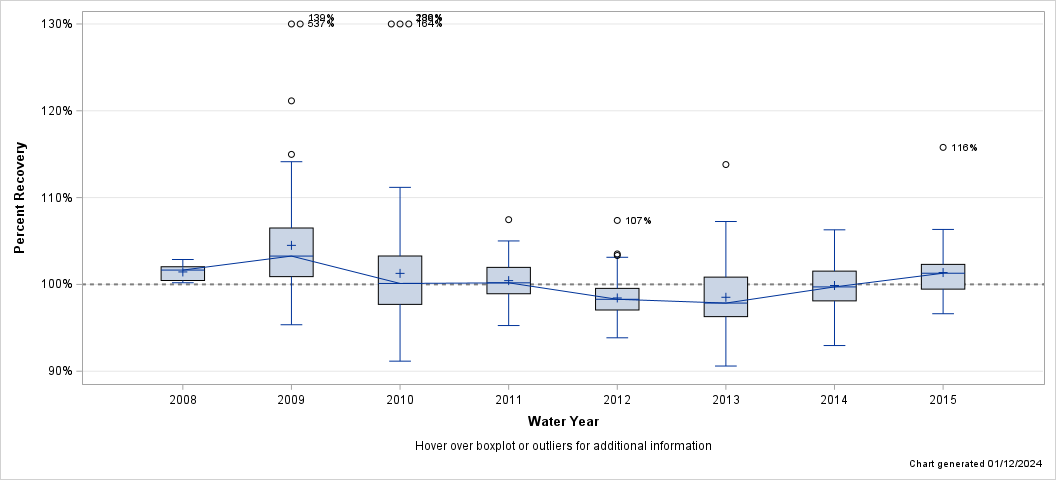
| Percent Recovery Statistics for Iron, UNF, ICP-OES |
| Analyte | Parm-meth Code | Water Year | # of Samples |
25th Pctl | 50th Pctl (Median) |
75th Pctl |
|---|---|---|---|---|---|---|
| Iron, UNF, ICP-OES | 01045PLA15 | 2008 | 5 | 100.4% | 101.7% | 102.0% |
| 2009 | 78 | 100.9% | 103.3% | 106.5% | ||
| 2010 | 96 | 97.7% | 100.1% | 103.3% | ||
| 2011 | 95 | 98.9% | 100.2% | 102.0% | ||
| 2012 | 110 | 97.1% | 98.3% | 99.5% | ||
| 2013 | 85 | 96.3% | 97.8% | 100.8% | ||
| 2014 | 85 | 98.1% | 99.7% | 101.5% | ||
| 2015 | 39 | 99.5% | 101.3% | 102.3% |
| Hover over boxplot or outliers for additional information |
| Chart generated 01/12/2024 |
| - Iron, UNF, ICP-OES - |
| Lab: NWQL, PCode: 01045, MCode: PLO07 |
| Analysis Dates: 05/28/15 through 09/26/23 |
| Open Data Set |
| Boxplot Description |
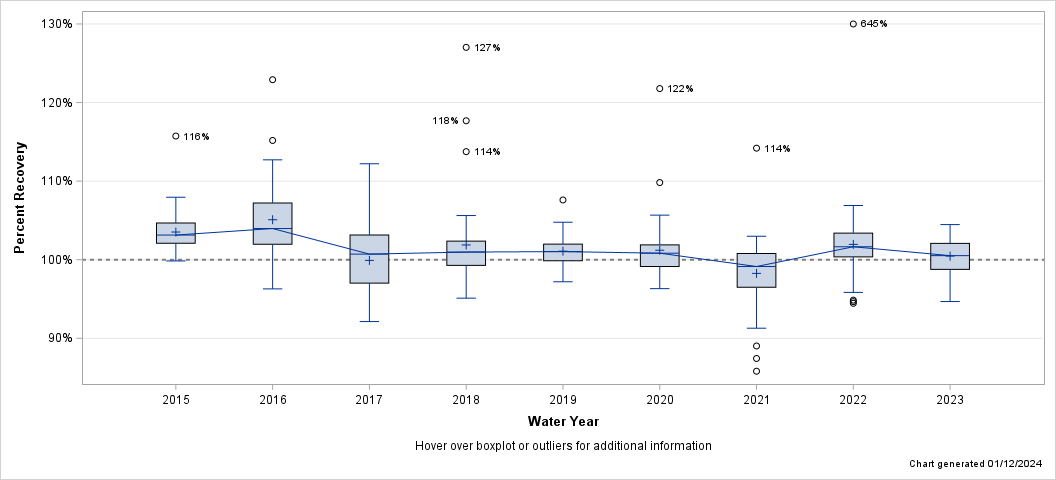
| Percent Recovery Statistics for Iron, UNF, ICP-OES |
| Analyte | Parm-meth Code | Water Year | # of Samples |
25th Pctl | 50th Pctl (Median) |
75th Pctl |
|---|---|---|---|---|---|---|
| Iron, UNF, ICP-OES | 01045PLO07 | 2015 | 51 | 102.1% | 103.1% | 104.7% |
| 2016 | 42 | 102.0% | 104.0% | 107.2% | ||
| 2017 | 42 | 97.0% | 100.7% | 103.1% | ||
| 2018 | 42 | 99.3% | 101.0% | 102.4% | ||
| 2019 | 39 | 99.9% | 101.0% | 102.0% | ||
| 2020 | 39 | 99.1% | 100.8% | 101.9% | ||
| 2021 | 42 | 96.5% | 99.1% | 100.8% | ||
| 2022 | 42 | 100.4% | 101.6% | 103.4% | ||
| 2023 | 40 | 98.8% | 100.5% | 102.1% |
| Hover over boxplot or outliers for additional information |
| Chart generated 01/12/2024 |
| - Lead, FIL, ICP-MS - |
| Lab: NWQL, PCode: 01049, MCode: PLM43 |
| Analysis Dates: 10/01/08 through 09/01/23 |
| Open Data Set |
| Boxplot Description |
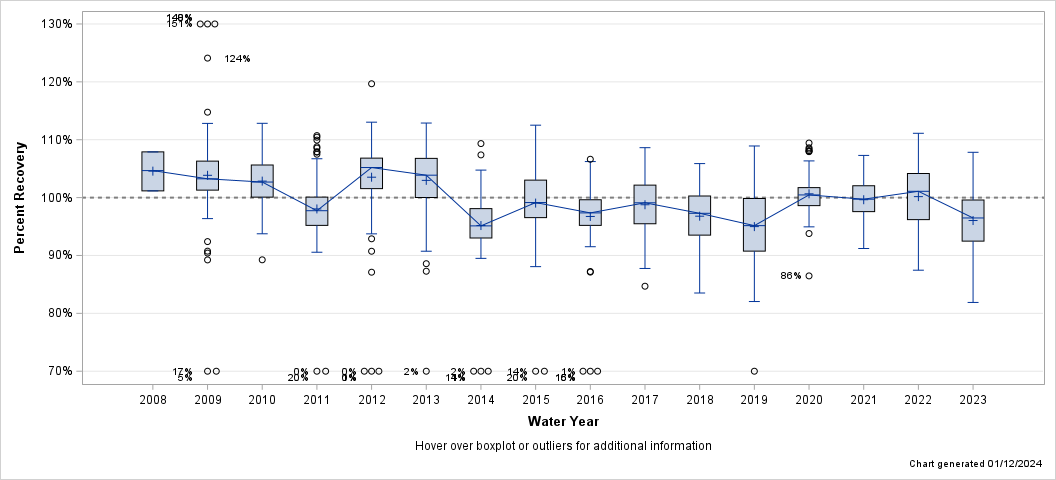
| Percent Recovery Statistics for Lead, FIL, ICP-MS |
| Analyte | Parm-meth Code | Water Year | # of Samples |
25th Pctl | 50th Pctl (Median) |
75th Pctl |
|---|---|---|---|---|---|---|
| Lead, FIL, ICP-MS | 01049PLM43 | 2008 | 3 | 101.2% | 104.7% | 107.9% |
| 2009 | 105 | 101.3% | 103.2% | 106.3% | ||
| 2010 | 132 | 100.1% | 102.7% | 105.6% | ||
| 2011 | 131 | 95.2% | 97.7% | 100.1% | ||
| 2012 | 132 | 101.6% | 105.2% | 106.8% | ||
| 2013 | 108 | 100.0% | 103.9% | 106.8% | ||
| 2014 | 83 | 93.0% | 95.1% | 98.1% | ||
| 2015 | 90 | 96.5% | 99.1% | 103.0% | ||
| 2016 | 90 | 95.2% | 97.4% | 99.6% | ||
| 2017 | 90 | 95.5% | 99.1% | 102.2% | ||
| 2018 | 90 | 93.5% | 97.3% | 100.3% | ||
| 2019 | 80 | 90.7% | 95.2% | 99.8% | ||
| 2020 | 85 | 98.6% | 100.5% | 101.7% | ||
| 2021 | 90 | 97.6% | 99.7% | 102.0% | ||
| 2022 | 88 | 96.2% | 101.1% | 104.2% | ||
| 2023 | 75 | 92.5% | 96.5% | 99.6% |
| Hover over boxplot or outliers for additional information |
| Chart generated 01/12/2024 |
| - Lead, UNF, ICP-MS - |
| Lab: NWQL, PCode: 01051, MCode: PLM48 |
| Analysis Dates: 10/07/08 through 04/30/15 |
| Open Data Set |
| Boxplot Description |
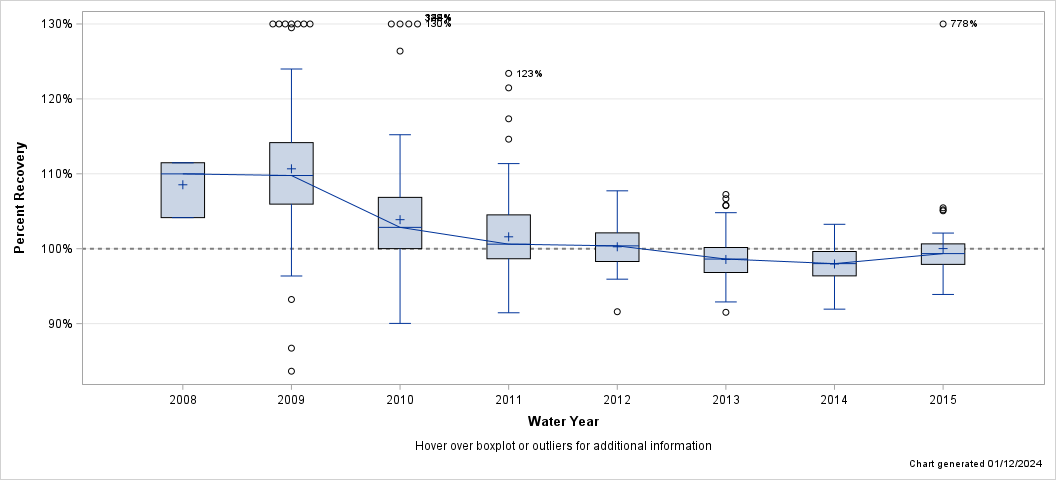
| Percent Recovery Statistics for Lead, UNF, ICP-MS |
| Analyte | Parm-meth Code | Water Year | # of Samples |
25th Pctl | 50th Pctl (Median) |
75th Pctl |
|---|---|---|---|---|---|---|
| Lead, UNF, ICP-MS | 01051PLM48 | 2008 | 3 | 104.1% | 110.0% | 111.5% |
| 2009 | 103 | 105.9% | 109.8% | 114.2% | ||
| 2010 | 131 | 100.0% | 102.9% | 106.9% | ||
| 2011 | 130 | 98.7% | 100.6% | 104.5% | ||
| 2012 | 83 | 98.3% | 100.4% | 102.1% | ||
| 2013 | 108 | 96.8% | 98.6% | 100.2% | ||
| 2014 | 83 | 96.4% | 98.0% | 99.6% | ||
| 2015 | 48 | 97.9% | 99.3% | 100.6% |
| Hover over boxplot or outliers for additional information |
| Chart generated 01/12/2024 |
| - Lead, UNF, ICP-MS - |
| Lab: NWQL, PCode: 01051, MCode: PLM78 |
| Analysis Dates: 05/12/15 through 09/27/23 |
| Open Data Set |
| Boxplot Description |
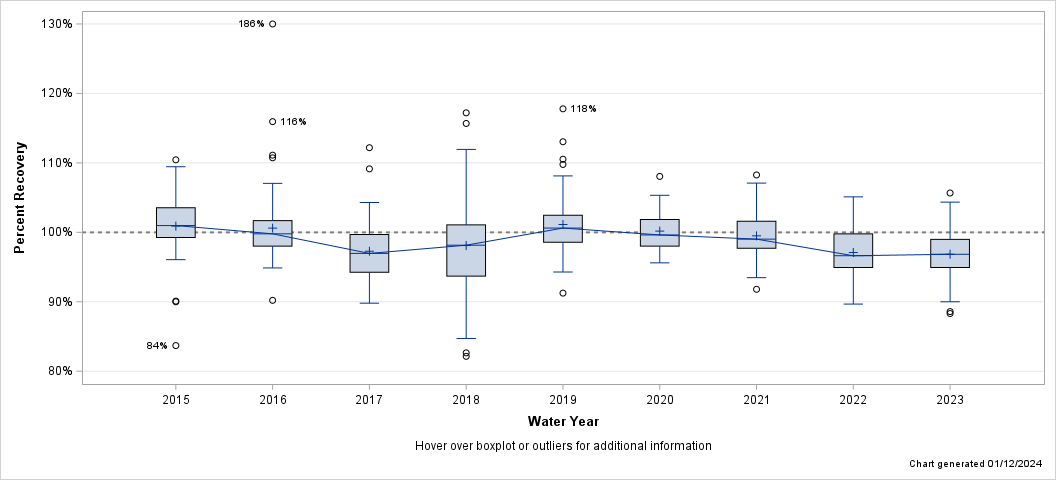
| Percent Recovery Statistics for Lead, UNF, ICP-MS |
| Analyte | Parm-meth Code | Water Year | # of Samples |
25th Pctl | 50th Pctl (Median) |
75th Pctl |
|---|---|---|---|---|---|---|
| Lead, UNF, ICP-MS | 01051PLM78 | 2015 | 42 | 99.3% | 101.0% | 103.5% |
| 2016 | 90 | 98.0% | 99.8% | 101.7% | ||
| 2017 | 90 | 94.3% | 97.0% | 99.7% | ||
| 2018 | 80 | 93.7% | 98.1% | 101.1% | ||
| 2019 | 56 | 98.6% | 100.6% | 102.4% | ||
| 2020 | 44 | 98.0% | 99.6% | 101.8% | ||
| 2021 | 48 | 97.7% | 99.0% | 101.6% | ||
| 2022 | 46 | 94.9% | 96.6% | 99.8% | ||
| 2023 | 44 | 94.9% | 96.8% | 99.0% |
| Hover over boxplot or outliers for additional information |
| Chart generated 01/12/2024 |
| - Lithium, FIL, ICP-MS - |
| Lab: NWQL, PCode: 01130, MCode: PLM40 |
| Analysis Dates: 10/01/08 through 09/01/23 |
| Open Data Set |
| Boxplot Description |
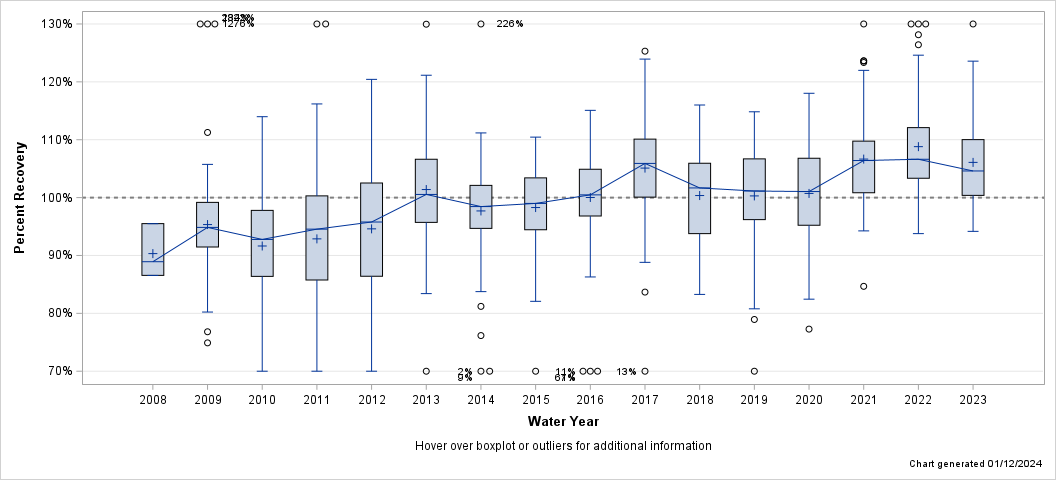
| Percent Recovery Statistics for Lithium, FIL, ICP-MS |
| Analyte | Parm-meth Code | Water Year | # of Samples |
25th Pctl | 50th Pctl (Median) |
75th Pctl |
|---|---|---|---|---|---|---|
| Lithium, FIL, ICP-MS | 01130PLM40 | 2008 | 3 | 86.6% | 88.9% | 95.5% |
| 2009 | 105 | 91.5% | 94.8% | 99.2% | ||
| 2010 | 132 | 86.4% | 92.8% | 97.8% | ||
| 2011 | 131 | 85.8% | 94.5% | 100.3% | ||
| 2012 | 132 | 86.4% | 95.8% | 102.5% | ||
| 2013 | 108 | 95.7% | 100.5% | 106.6% | ||
| 2014 | 83 | 94.7% | 98.4% | 102.1% | ||
| 2015 | 90 | 94.4% | 99.0% | 103.4% | ||
| 2016 | 112 | 96.8% | 100.5% | 104.9% | ||
| 2017 | 105 | 100.1% | 105.9% | 110.1% | ||
| 2018 | 90 | 93.8% | 101.7% | 105.9% | ||
| 2019 | 80 | 96.2% | 101.1% | 106.7% | ||
| 2020 | 85 | 95.2% | 101.0% | 106.8% | ||
| 2021 | 90 | 100.8% | 106.4% | 109.8% | ||
| 2022 | 88 | 103.4% | 106.6% | 112.1% | ||
| 2023 | 75 | 100.4% | 104.6% | 110.0% |
| Hover over boxplot or outliers for additional information |
| Chart generated 01/12/2024 |
| - Lithium, FIL, ICP-OES - |
| Lab: NWQL, PCode: 01130, MCode: PLA11 |
| Analysis Dates: 10/04/08 through 08/06/16 |
| Open Data Set |
| Boxplot Description |
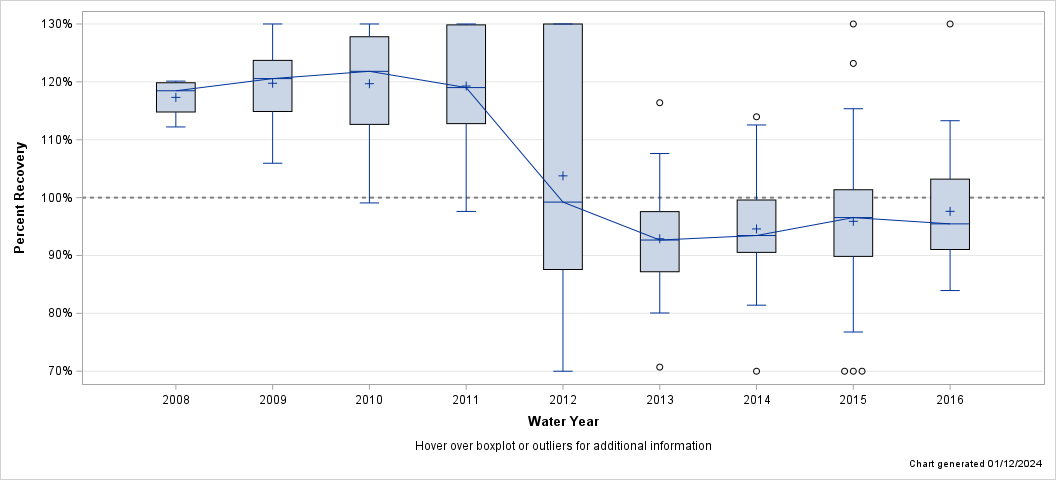
| Percent Recovery Statistics for Lithium, FIL, ICP-OES |
| Analyte | Parm-meth Code | Water Year | # of Samples |
25th Pctl | 50th Pctl (Median) |
75th Pctl |
|---|---|---|---|---|---|---|
| Lithium, FIL, ICP-OES | 01130PLA11 | 2008 | 4 | 114.8% | 118.5% | 119.8% |
| 2009 | 34 | 114.9% | 120.6% | 123.7% | ||
| 2010 | 42 | 112.7% | 121.8% | 127.8% | ||
| 2011 | 41 | 112.8% | 119.0% | 129.9% | ||
| 2012 | 42 | 87.6% | 99.2% | 131.0% | ||
| 2013 | 42 | 87.2% | 92.7% | 97.6% | ||
| 2014 | 46 | 90.5% | 93.4% | 99.6% | ||
| 2015 | 42 | 89.8% | 96.5% | 101.3% | ||
| 2016 | 18 | 91.0% | 95.5% | 103.2% |
| Hover over boxplot or outliers for additional information |
| Chart generated 01/12/2024 |
| - Lithium, UNF, ICP-MS - |
| Lab: NWQL, PCode: 01132, MCode: PLM48 |
| Analysis Dates: 10/11/12 through 04/30/15 |
| Open Data Set |
| Boxplot Description |
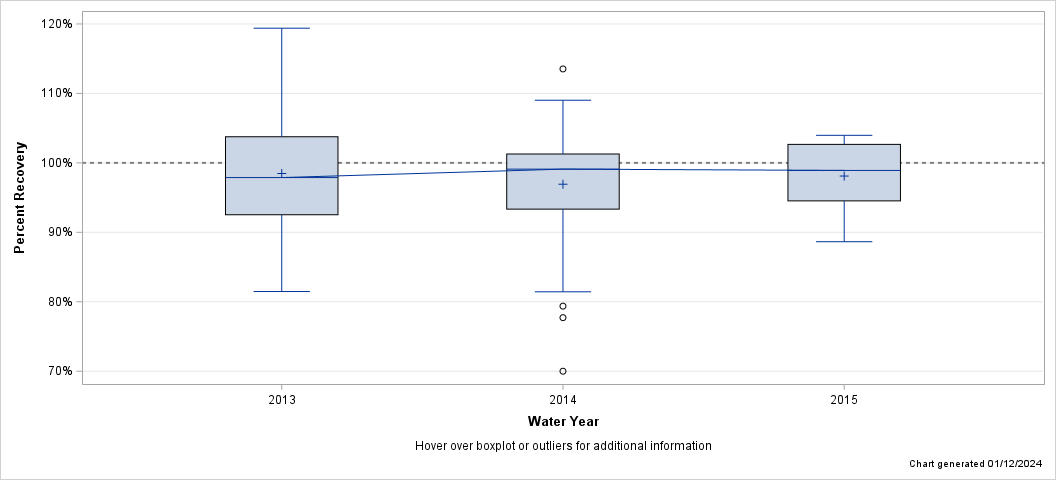
| Percent Recovery Statistics for Lithium, UNF, ICP-MS |
| Analyte | Parm-meth Code | Water Year | # of Samples |
25th Pctl | 50th Pctl (Median) |
75th Pctl |
|---|---|---|---|---|---|---|
| Lithium, UNF, ICP-MS | 01132PLM48 | 2013 | 48 | 92.5% | 97.9% | 103.8% |
| 2014 | 45 | 93.3% | 99.1% | 101.3% | ||
| 2015 | 27 | 94.5% | 98.9% | 102.7% |
| Hover over boxplot or outliers for additional information |
| Chart generated 01/12/2024 |
| - Lithium, UNF, ICP-MS - |
| Lab: NWQL, PCode: 01132, MCode: PLM78 |
| Analysis Dates: 05/12/15 through 09/27/23 |
| Open Data Set |
| Boxplot Description |
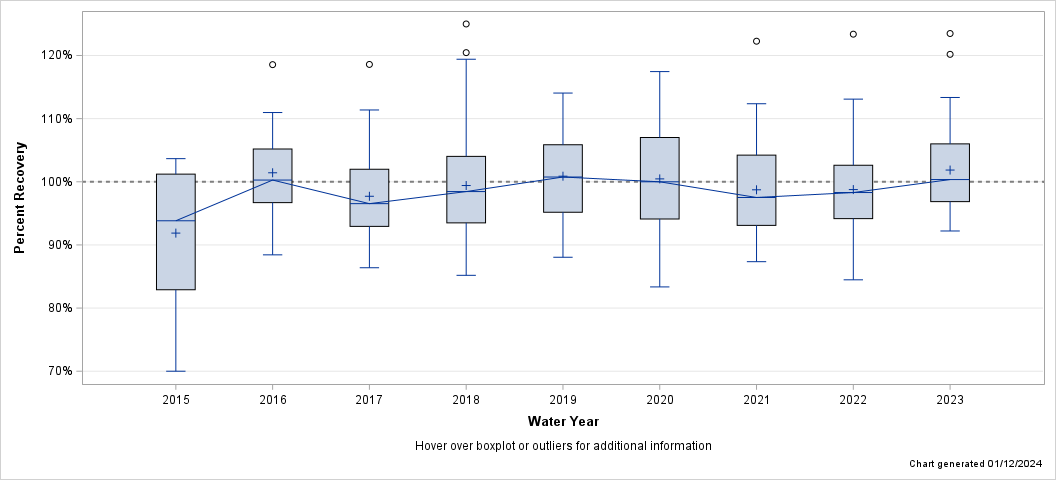
| Percent Recovery Statistics for Lithium, UNF, ICP-MS |
| Analyte | Parm-meth Code | Water Year | # of Samples |
25th Pctl | 50th Pctl (Median) |
75th Pctl |
|---|---|---|---|---|---|---|
| Lithium, UNF, ICP-MS | 01132PLM78 | 2015 | 21 | 82.9% | 93.8% | 101.2% |
| 2016 | 48 | 96.7% | 100.3% | 105.2% | ||
| 2017 | 48 | 92.9% | 96.5% | 102.0% | ||
| 2018 | 48 | 93.5% | 98.4% | 104.0% | ||
| 2019 | 41 | 95.2% | 100.8% | 105.9% | ||
| 2020 | 44 | 94.1% | 100.0% | 107.0% | ||
| 2021 | 48 | 93.1% | 97.5% | 104.2% | ||
| 2022 | 46 | 94.2% | 98.3% | 102.6% | ||
| 2023 | 44 | 96.9% | 100.4% | 106.0% |
| Hover over boxplot or outliers for additional information |
| Chart generated 01/12/2024 |
| - Manganese, FIL, ICP-MS - |
| Lab: NWQL, PCode: 01056, MCode: PLM43 |
| Analysis Dates: 10/01/08 through 09/01/23 |
| Open Data Set |
| Boxplot Description |
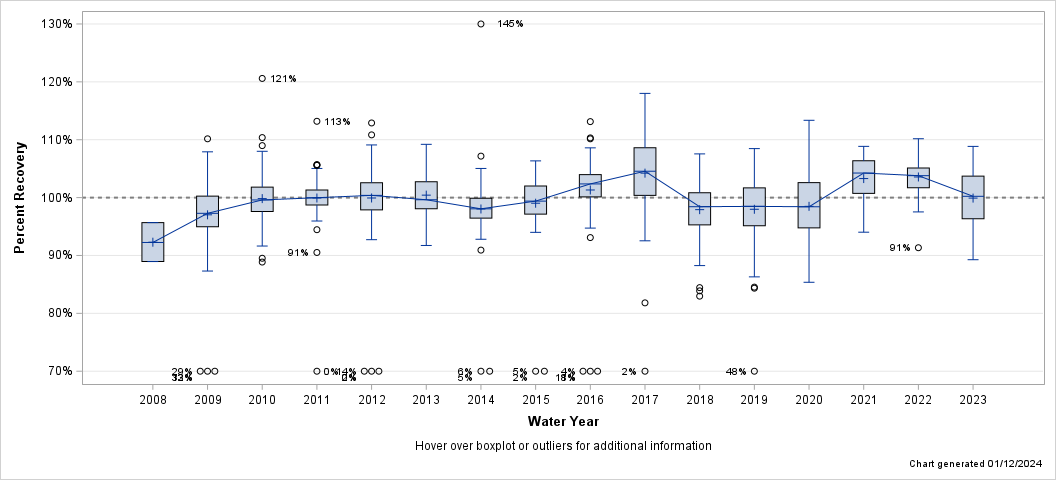
| Percent Recovery Statistics for Manganese, FIL, ICP-MS |
| Analyte | Parm-meth Code | Water Year | # of Samples |
25th Pctl | 50th Pctl (Median) |
75th Pctl |
|---|---|---|---|---|---|---|
| Manganese, FIL, ICP-MS | 01056PLM43 | 2008 | 3 | 88.9% | 92.2% | 95.7% |
| 2009 | 105 | 95.0% | 97.3% | 100.2% | ||
| 2010 | 132 | 97.6% | 99.6% | 101.8% | ||
| 2011 | 131 | 98.7% | 100.0% | 101.3% | ||
| 2012 | 132 | 97.9% | 100.4% | 102.6% | ||
| 2013 | 108 | 98.1% | 99.6% | 102.7% | ||
| 2014 | 83 | 96.5% | 98.1% | 99.9% | ||
| 2015 | 90 | 97.2% | 99.4% | 102.0% | ||
| 2016 | 90 | 100.1% | 102.4% | 104.0% | ||
| 2017 | 90 | 100.4% | 104.6% | 108.6% | ||
| 2018 | 90 | 95.3% | 98.4% | 100.8% | ||
| 2019 | 80 | 95.1% | 98.5% | 101.7% | ||
| 2020 | 85 | 94.8% | 98.4% | 102.6% | ||
| 2021 | 90 | 100.7% | 104.2% | 106.4% | ||
| 2022 | 88 | 101.7% | 103.8% | 105.1% | ||
| 2023 | 75 | 96.3% | 100.2% | 103.7% |
| Hover over boxplot or outliers for additional information |
| Chart generated 01/12/2024 |
| - Manganese, FIL, ICP-OES - |
| Lab: NWQL, PCode: 01056, MCode: PLA11 |
| Analysis Dates: 10/04/08 through 09/28/23 |
| Open Data Set |
| Boxplot Description |
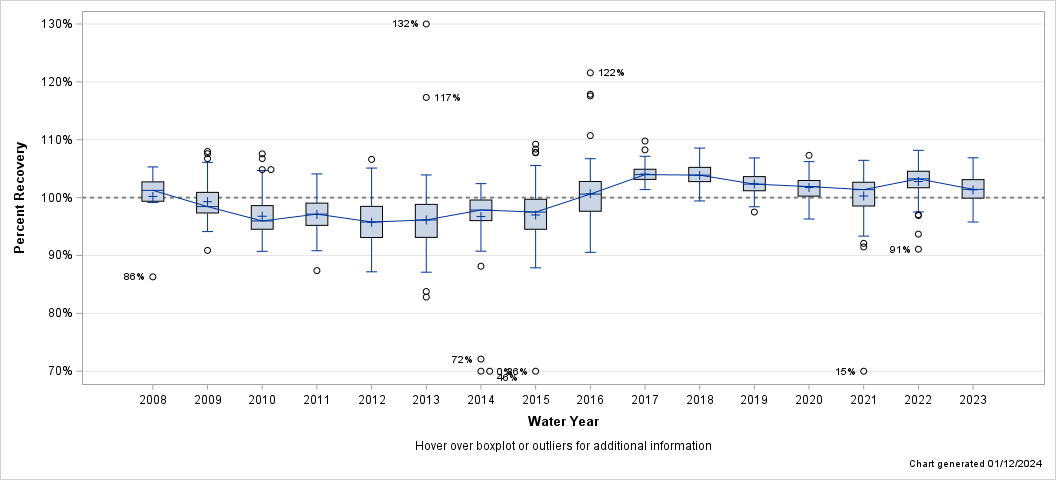
| Percent Recovery Statistics for Manganese, FIL, ICP-OES |
| Analyte | Parm-meth Code | Water Year | # of Samples |
25th Pctl | 50th Pctl (Median) |
75th Pctl |
|---|---|---|---|---|---|---|
| Manganese, FIL, ICP-OES | 01056PLA11 | 2008 | 11 | 99.4% | 101.3% | 102.7% |
| 2009 | 34 | 97.3% | 98.4% | 100.9% | ||
| 2010 | 144 | 94.5% | 96.0% | 98.6% | ||
| 2011 | 143 | 95.2% | 97.1% | 99.0% | ||
| 2012 | 140 | 93.1% | 95.8% | 98.5% | ||
| 2013 | 121 | 93.1% | 96.1% | 98.8% | ||
| 2014 | 107 | 96.0% | 97.9% | 99.6% | ||
| 2015 | 114 | 94.5% | 97.5% | 99.7% | ||
| 2016 | 112 | 97.6% | 100.6% | 102.8% | ||
| 2017 | 108 | 103.1% | 104.0% | 104.9% | ||
| 2018 | 108 | 102.8% | 103.9% | 105.2% | ||
| 2019 | 98 | 101.2% | 102.3% | 103.6% | ||
| 2020 | 101 | 100.2% | 101.9% | 103.0% | ||
| 2021 | 107 | 98.5% | 101.4% | 102.7% | ||
| 2022 | 107 | 101.7% | 103.2% | 104.5% | ||
| 2023 | 107 | 99.9% | 101.4% | 103.1% |
| Hover over boxplot or outliers for additional information |
| Chart generated 01/12/2024 |
| - Manganese, UNF, ICP-MS - |
| Lab: NWQL, PCode: 01055, MCode: PLM48 |
| Analysis Dates: 10/15/08 through 04/30/15 |
| Open Data Set |
| Boxplot Description |
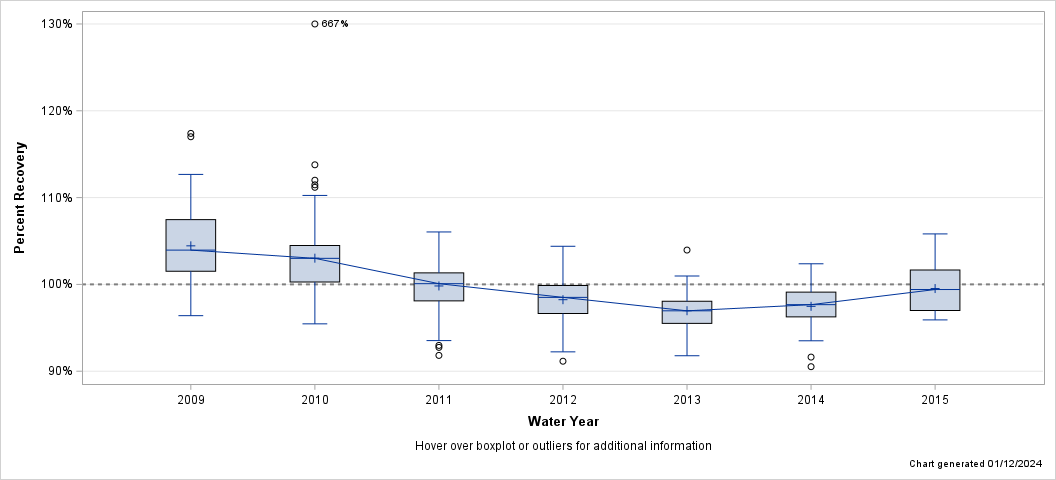
| Percent Recovery Statistics for Manganese, UNF, ICP-MS |
| Analyte | Parm-meth Code | Water Year | # of Samples |
25th Pctl | 50th Pctl (Median) |
75th Pctl |
|---|---|---|---|---|---|---|
| Manganese, UNF, ICP-MS | 01055PLM48 | 2009 | 65 | 101.5% | 104.0% | 107.5% |
| 2010 | 84 | 100.3% | 103.0% | 104.5% | ||
| 2011 | 130 | 98.1% | 100.1% | 101.3% | ||
| 2012 | 82 | 96.6% | 98.5% | 99.9% | ||
| 2013 | 48 | 95.5% | 97.0% | 98.1% | ||
| 2014 | 45 | 96.3% | 97.7% | 99.1% | ||
| 2015 | 27 | 97.0% | 99.4% | 101.7% |
| Hover over boxplot or outliers for additional information |
| Chart generated 01/12/2024 |
| - Manganese, UNF, ICP-MS - |
| Lab: NWQL, PCode: 01055, MCode: PLM78 |
| Analysis Dates: 05/12/15 through 09/27/23 |
| Open Data Set |
| Boxplot Description |
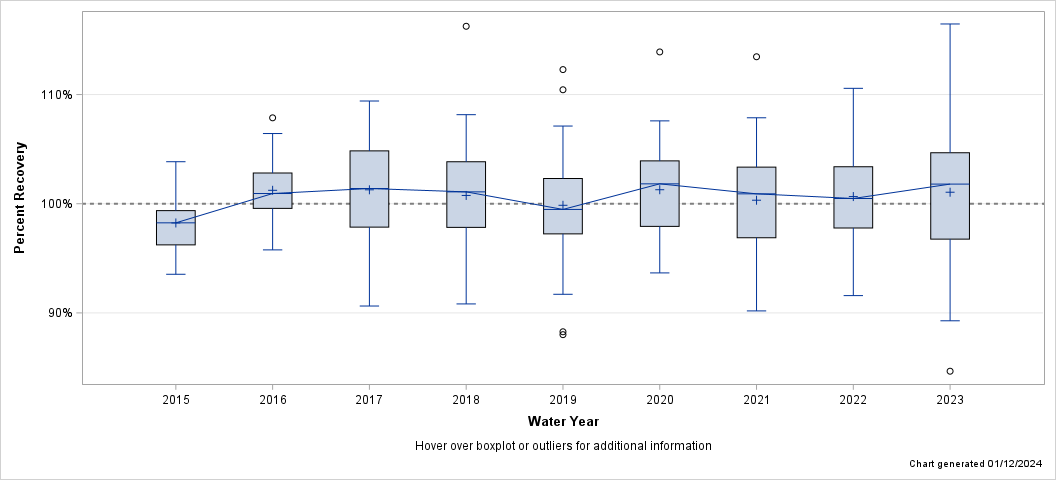
| Percent Recovery Statistics for Manganese, UNF, ICP-MS |
| Analyte | Parm-meth Code | Water Year | # of Samples |
25th Pctl | 50th Pctl (Median) |
75th Pctl |
|---|---|---|---|---|---|---|
| Manganese, UNF, ICP-MS | 01055PLM78 | 2015 | 21 | 96.2% | 98.2% | 99.4% |
| 2016 | 48 | 99.6% | 100.9% | 102.8% | ||
| 2017 | 48 | 97.9% | 101.4% | 104.8% | ||
| 2018 | 48 | 97.8% | 101.1% | 103.8% | ||
| 2019 | 41 | 97.2% | 99.5% | 102.3% | ||
| 2020 | 44 | 97.9% | 101.8% | 103.9% | ||
| 2021 | 48 | 96.9% | 100.9% | 103.4% | ||
| 2022 | 46 | 97.8% | 100.5% | 103.4% | ||
| 2023 | 44 | 96.8% | 101.8% | 104.7% |
| Hover over boxplot or outliers for additional information |
| Chart generated 01/12/2024 |
| - Manganese, UNF, ICP-OES - |
| Lab: NWQL, PCode: 01055, MCode: PLA15 |
| Analysis Dates: 10/03/08 through 03/27/15 |
| Open Data Set |
| Boxplot Description |
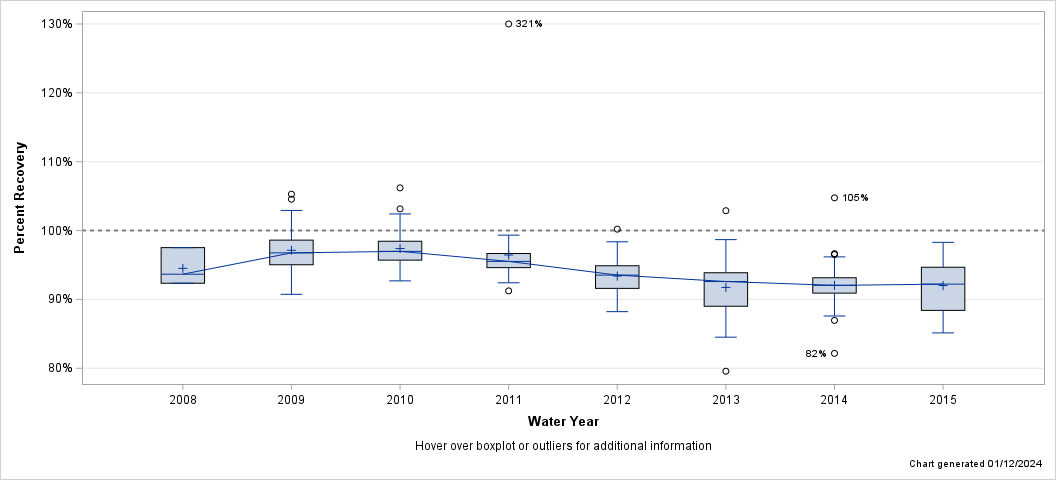
| Percent Recovery Statistics for Manganese, UNF, ICP-OES |
| Analyte | Parm-meth Code | Water Year | # of Samples |
25th Pctl | 50th Pctl (Median) |
75th Pctl |
|---|---|---|---|---|---|---|
| Manganese, UNF, ICP-OES | 01055PLA15 | 2008 | 3 | 92.4% | 93.7% | 97.5% |
| 2009 | 34 | 95.0% | 96.8% | 98.6% | ||
| 2010 | 42 | 95.7% | 97.0% | 98.4% | ||
| 2011 | 41 | 94.6% | 95.5% | 96.7% | ||
| 2012 | 42 | 91.6% | 93.5% | 94.9% | ||
| 2013 | 42 | 89.0% | 92.6% | 93.9% | ||
| 2014 | 85 | 90.9% | 92.0% | 93.1% | ||
| 2015 | 39 | 88.4% | 92.2% | 94.7% |
| Hover over boxplot or outliers for additional information |
| Chart generated 01/12/2024 |
| - Manganese, UNF, ICP-OES - |
| Lab: NWQL, PCode: 01055, MCode: PLO07 |
| Analysis Dates: 05/28/15 through 09/20/23 |
| Open Data Set |
| Boxplot Description |
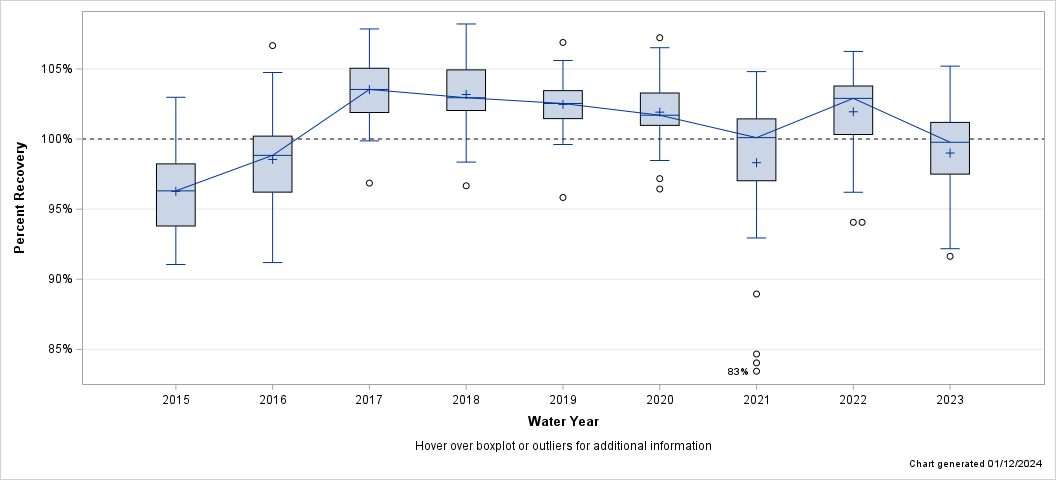
| Percent Recovery Statistics for Manganese, UNF, ICP-OES |
| Analyte | Parm-meth Code | Water Year | # of Samples |
25th Pctl | 50th Pctl (Median) |
75th Pctl |
|---|---|---|---|---|---|---|
| Manganese, UNF, ICP-OES | 01055PLO07 | 2015 | 51 | 93.8% | 96.3% | 98.2% |
| 2016 | 42 | 96.2% | 98.8% | 100.2% | ||
| 2017 | 42 | 101.9% | 103.5% | 105.1% | ||
| 2018 | 42 | 102.0% | 102.9% | 104.9% | ||
| 2019 | 39 | 101.5% | 102.5% | 103.5% | ||
| 2020 | 39 | 101.0% | 101.7% | 103.3% | ||
| 2021 | 42 | 97.0% | 100.1% | 101.4% | ||
| 2022 | 42 | 100.3% | 102.9% | 103.8% | ||
| 2023 | 39 | 97.5% | 99.8% | 101.2% |
| Hover over boxplot or outliers for additional information |
| Chart generated 01/12/2024 |
| - Mercury, FIL,CVAF - |
| Lab: NWQL, PCode: 71890, MCode: CV014 |
| Analysis Dates: 10/02/08 through 09/07/23 |
| Open Data Set |
| Boxplot Description |
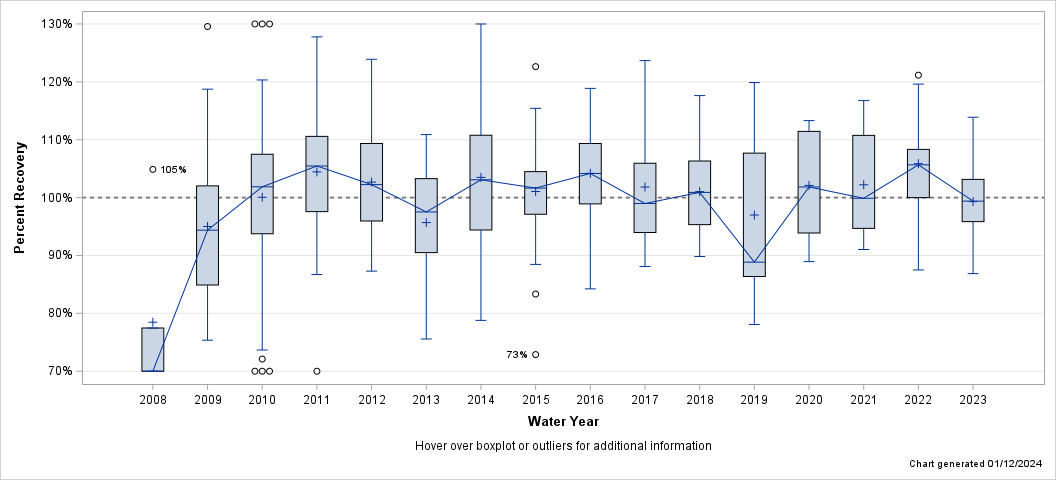
| Percent Recovery Statistics for Mercury, FIL,CVAF |
| Analyte | Parm-meth Code | Water Year | # of Samples |
25th Pctl | 50th Pctl (Median) |
75th Pctl |
|---|---|---|---|---|---|---|
| Mercury, FIL,CVAF | 71890CV014 | 2008 | 5 | 49.5% | 57.2% | 77.5% |
| 2009 | 40 | 84.9% | 94.4% | 102.0% | ||
| 2010 | 80 | 93.8% | 101.9% | 107.5% | ||
| 2011 | 82 | 97.6% | 105.5% | 110.6% | ||
| 2012 | 48 | 96.0% | 102.2% | 109.3% | ||
| 2013 | 48 | 90.5% | 97.5% | 103.3% | ||
| 2014 | 45 | 94.4% | 103.1% | 110.8% | ||
| 2015 | 48 | 97.1% | 101.6% | 104.5% | ||
| 2016 | 48 | 98.9% | 104.2% | 109.3% | ||
| 2017 | 24 | 94.0% | 99.0% | 105.9% | ||
| 2018 | 24 | 95.3% | 100.9% | 106.3% | ||
| 2019 | 13 | 86.4% | 88.8% | 107.7% | ||
| 2020 | 10 | 93.9% | 101.8% | 111.4% | ||
| 2021 | 23 | 94.7% | 99.9% | 110.8% | ||
| 2022 | 22 | 100.0% | 105.7% | 108.3% | ||
| 2023 | 21 | 95.9% | 99.4% | 103.1% |
| Hover over boxplot or outliers for additional information |
| Chart generated 01/12/2024 |
| - Mercury, UNF,CVAF - |
| Lab: NWQL, PCode: 71900, MCode: CV018 |
| Analysis Dates: 10/01/08 through 09/25/23 |
| Open Data Set |
| Boxplot Description |
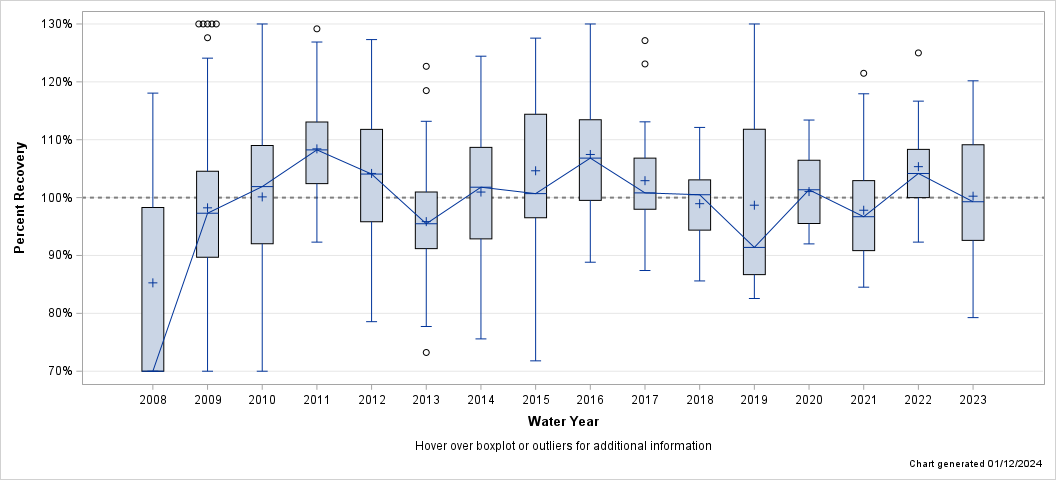
| Percent Recovery Statistics for Mercury, UNF,CVAF |
| Analyte | Parm-meth Code | Water Year | # of Samples |
25th Pctl | 50th Pctl (Median) |
75th Pctl |
|---|---|---|---|---|---|---|
| Mercury, UNF,CVAF | 71900CV018 | 2008 | 5 | 51.5% | 53.7% | 98.3% |
| 2009 | 99 | 89.7% | 97.3% | 104.6% | ||
| 2010 | 80 | 92.0% | 101.9% | 109.0% | ||
| 2011 | 83 | 102.4% | 108.2% | 113.1% | ||
| 2012 | 84 | 95.8% | 104.1% | 111.8% | ||
| 2013 | 60 | 91.2% | 95.5% | 101.0% | ||
| 2014 | 45 | 92.9% | 101.8% | 108.7% | ||
| 2015 | 48 | 96.5% | 100.7% | 114.4% | ||
| 2016 | 48 | 99.5% | 106.8% | 113.5% | ||
| 2017 | 24 | 98.0% | 100.8% | 106.8% | ||
| 2018 | 24 | 94.4% | 100.5% | 103.1% | ||
| 2019 | 13 | 86.7% | 91.4% | 111.8% | ||
| 2020 | 10 | 95.5% | 101.4% | 106.5% | ||
| 2021 | 24 | 90.8% | 96.7% | 102.9% | ||
| 2022 | 22 | 100.0% | 104.2% | 108.3% | ||
| 2023 | 24 | 92.6% | 99.3% | 109.1% |
| Hover over boxplot or outliers for additional information |
| Chart generated 01/12/2024 |
| - Molybdenum, FIL, ICP-MS - |
| Lab: NWQL, PCode: 01060, MCode: PLM43 |
| Analysis Dates: 10/01/08 through 09/01/23 |
| Open Data Set |
| Boxplot Description |
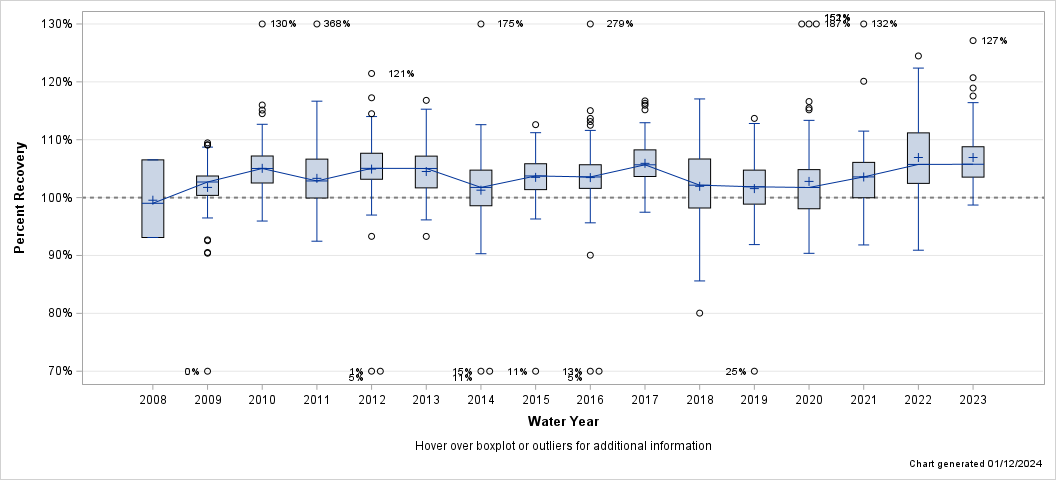
| Percent Recovery Statistics for Molybdenum, FIL, ICP-MS |
| Analyte | Parm-meth Code | Water Year | # of Samples |
25th Pctl | 50th Pctl (Median) |
75th Pctl |
|---|---|---|---|---|---|---|
| Molybdenum, FIL, ICP-MS | 01060PLM43 | 2008 | 3 | 93.1% | 99.0% | 106.5% |
| 2009 | 105 | 100.4% | 102.7% | 103.7% | ||
| 2010 | 132 | 102.5% | 105.0% | 107.2% | ||
| 2011 | 131 | 99.9% | 102.9% | 106.6% | ||
| 2012 | 132 | 103.2% | 105.1% | 107.7% | ||
| 2013 | 108 | 101.7% | 105.0% | 107.2% | ||
| 2014 | 83 | 98.6% | 101.8% | 104.7% | ||
| 2015 | 90 | 101.4% | 103.7% | 105.9% | ||
| 2016 | 90 | 101.6% | 103.6% | 105.7% | ||
| 2017 | 90 | 103.6% | 105.7% | 108.2% | ||
| 2018 | 90 | 98.2% | 102.1% | 106.7% | ||
| 2019 | 80 | 98.9% | 101.9% | 104.7% | ||
| 2020 | 85 | 98.1% | 101.7% | 104.8% | ||
| 2021 | 90 | 100.0% | 103.6% | 106.1% | ||
| 2022 | 88 | 102.5% | 105.7% | 111.2% | ||
| 2023 | 75 | 103.5% | 105.8% | 108.8% |
| Hover over boxplot or outliers for additional information |
| Chart generated 01/12/2024 |
| - Molybdenum, UNF, ICP-MS - |
| Lab: NWQL, PCode: 01062, MCode: PLM48 |
| Analysis Dates: 10/15/08 through 04/30/15 |
| Open Data Set |
| Boxplot Description |
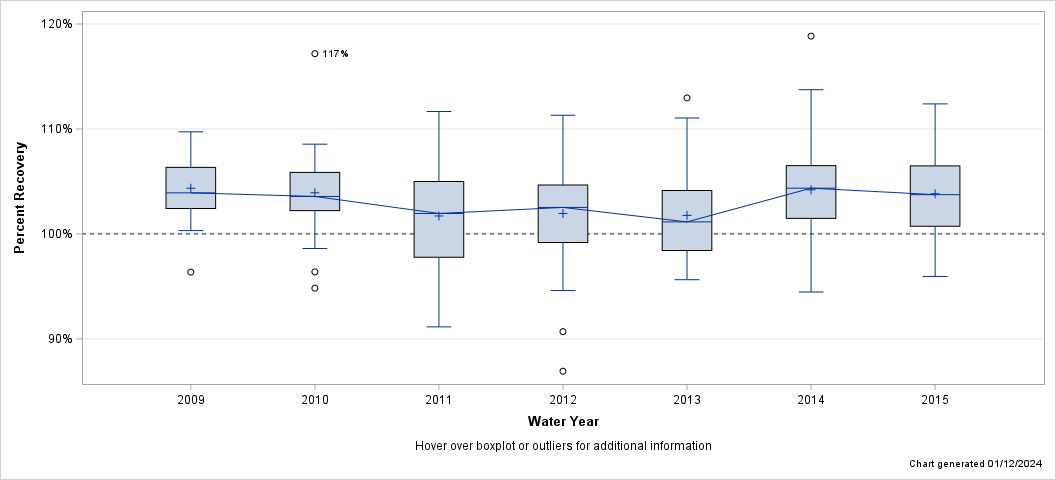
| Percent Recovery Statistics for Molybdenum, UNF, ICP-MS |
| Analyte | Parm-meth Code | Water Year | # of Samples |
25th Pctl | 50th Pctl (Median) |
75th Pctl |
|---|---|---|---|---|---|---|
| Molybdenum, UNF, ICP-MS | 01062PLM48 | 2009 | 39 | 102.4% | 103.9% | 106.3% |
| 2010 | 48 | 102.2% | 103.6% | 105.9% | ||
| 2011 | 48 | 97.8% | 101.9% | 105.0% | ||
| 2012 | 48 | 99.2% | 102.5% | 104.7% | ||
| 2013 | 48 | 98.4% | 101.1% | 104.1% | ||
| 2014 | 45 | 101.5% | 104.4% | 106.5% | ||
| 2015 | 27 | 100.7% | 103.7% | 106.5% |
| Hover over boxplot or outliers for additional information |
| Chart generated 01/12/2024 |
| - Molybdenum, UNF, ICP-MS - |
| Lab: NWQL, PCode: 01062, MCode: PLM78 |
| Analysis Dates: 05/12/15 through 09/27/23 |
| Open Data Set |
| Boxplot Description |
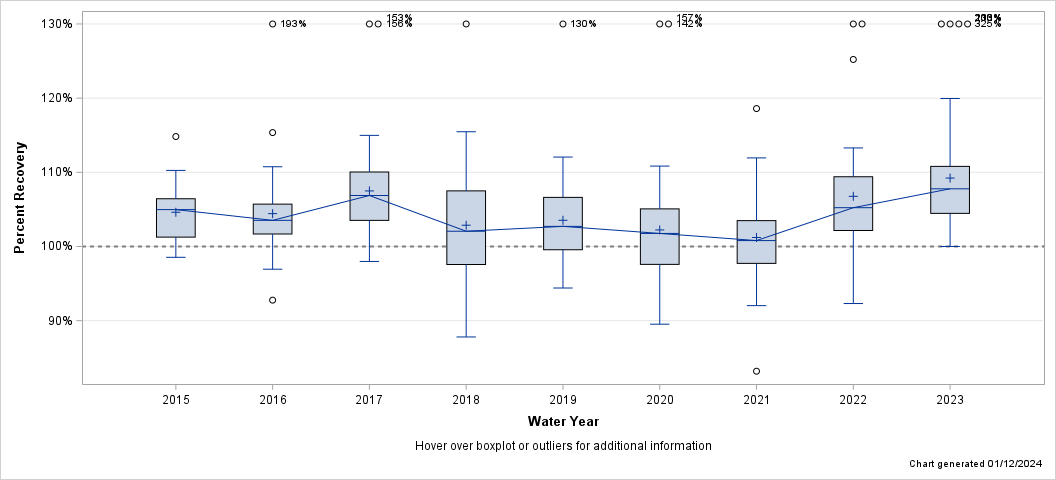
| Percent Recovery Statistics for Molybdenum, UNF, ICP-MS |
| Analyte | Parm-meth Code | Water Year | # of Samples |
25th Pctl | 50th Pctl (Median) |
75th Pctl |
|---|---|---|---|---|---|---|
| Molybdenum, UNF, ICP-MS | 01062PLM78 | 2015 | 21 | 101.3% | 105.0% | 106.4% |
| 2016 | 48 | 101.7% | 103.5% | 105.7% | ||
| 2017 | 48 | 103.5% | 106.9% | 110.0% | ||
| 2018 | 48 | 97.6% | 102.1% | 107.5% | ||
| 2019 | 41 | 99.6% | 102.7% | 106.6% | ||
| 2020 | 44 | 97.6% | 101.8% | 105.1% | ||
| 2021 | 48 | 97.7% | 100.8% | 103.5% | ||
| 2022 | 46 | 102.2% | 105.2% | 109.4% | ||
| 2023 | 44 | 104.5% | 107.8% | 110.8% |
| Hover over boxplot or outliers for additional information |
| Chart generated 01/12/2024 |
| - Nickel, FIL, cICP-MS - |
| Lab: NWQL, PCode: 01065, MCode: PLM10 |
| Analysis Dates: 10/01/08 through 09/01/23 |
| Open Data Set |
| Boxplot Description |
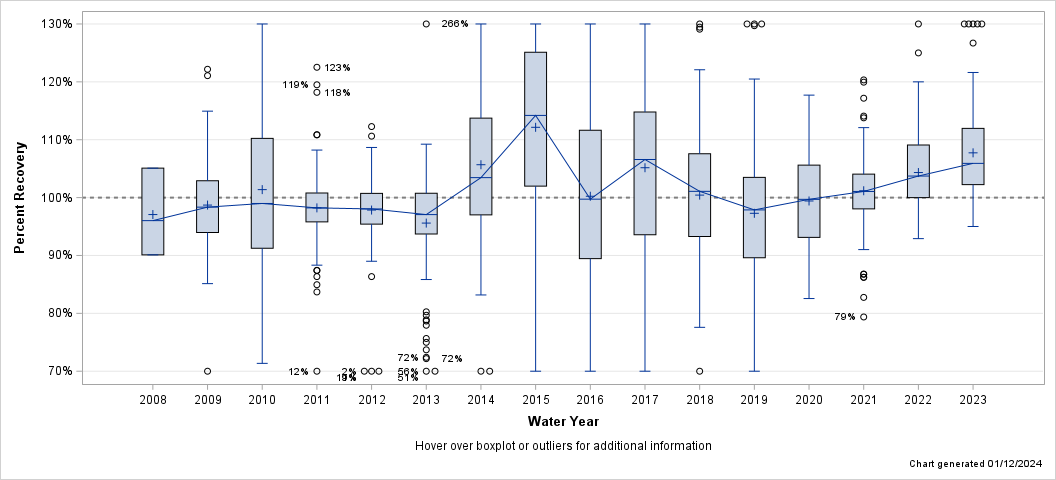
| Percent Recovery Statistics for Nickel, FIL, cICP-MS |
| Analyte | Parm-meth Code | Water Year | # of Samples |
25th Pctl | 50th Pctl (Median) |
75th Pctl |
|---|---|---|---|---|---|---|
| Nickel, FIL, cICP-MS | 01065PLM10 | 2008 | 3 | 90.1% | 96.0% | 105.1% |
| 2009 | 105 | 94.0% | 98.4% | 102.9% | ||
| 2010 | 132 | 91.3% | 99.0% | 110.2% | ||
| 2011 | 131 | 95.8% | 98.2% | 100.8% | ||
| 2012 | 132 | 95.4% | 98.0% | 100.7% | ||
| 2013 | 108 | 93.7% | 97.1% | 100.7% | ||
| 2014 | 83 | 97.0% | 103.4% | 113.7% | ||
| 2015 | 44 | 102.0% | 114.2% | 125.1% | ||
| 2016 | 74 | 89.4% | 99.7% | 111.6% | ||
| 2017 | 90 | 93.6% | 106.6% | 114.8% | ||
| 2018 | 90 | 93.3% | 101.1% | 107.6% | ||
| 2019 | 80 | 89.6% | 97.9% | 103.5% | ||
| 2020 | 85 | 93.1% | 99.7% | 105.6% | ||
| 2021 | 90 | 98.0% | 101.1% | 104.0% | ||
| 2022 | 88 | 100.0% | 103.7% | 109.1% | ||
| 2023 | 75 | 102.2% | 105.9% | 112.0% |
| Hover over boxplot or outliers for additional information |
| Chart generated 01/12/2024 |
| - Nickel, UNF, cICP-MS - |
| Lab: NWQL, PCode: 01067, MCode: PLM11 |
| Analysis Dates: 10/06/08 through 04/30/15 |
| Open Data Set |
| Boxplot Description |
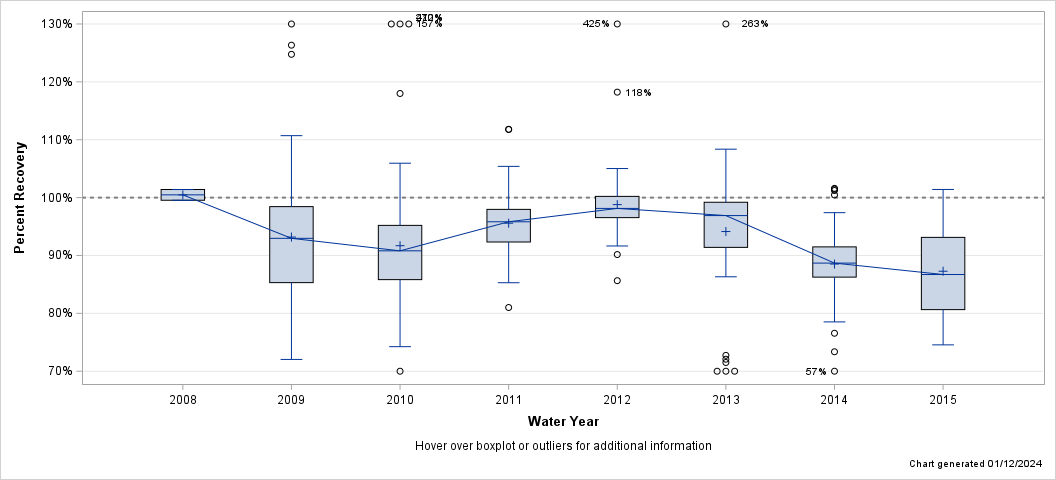
| Percent Recovery Statistics for Nickel, UNF, cICP-MS |
| Analyte | Parm-meth Code | Water Year | # of Samples |
25th Pctl | 50th Pctl (Median) |
75th Pctl |
|---|---|---|---|---|---|---|
| Nickel, UNF, cICP-MS | 01067PLM11 | 2008 | 3 | 99.5% | 100.5% | 101.4% |
| 2009 | 65 | 85.3% | 93.0% | 98.4% | ||
| 2010 | 84 | 85.8% | 90.8% | 95.2% | ||
| 2011 | 82 | 92.3% | 95.8% | 98.0% | ||
| 2012 | 48 | 96.5% | 98.1% | 100.2% | ||
| 2013 | 48 | 91.4% | 96.9% | 99.2% | ||
| 2014 | 45 | 86.3% | 88.7% | 91.5% | ||
| 2015 | 14 | 80.7% | 86.7% | 93.1% |
| Hover over boxplot or outliers for additional information |
| Chart generated 01/12/2024 |
| - Nickel, UNF, cICP-MS - |
| Lab: NWQL, PCode: 01067, MCode: PLM77 |
| Analysis Dates: 05/12/15 through 09/27/23 |
| Open Data Set |
| Boxplot Description |
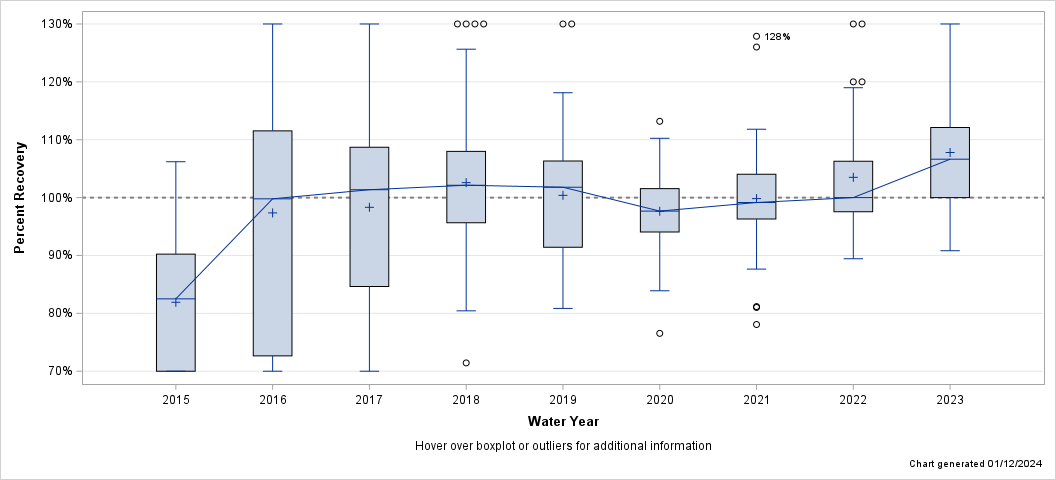
| Percent Recovery Statistics for Nickel, UNF, cICP-MS |
| Analyte | Parm-meth Code | Water Year | # of Samples |
25th Pctl | 50th Pctl (Median) |
75th Pctl |
|---|---|---|---|---|---|---|
| Nickel, UNF, cICP-MS | 01067PLM77 | 2015 | 22 | 56.8% | 82.5% | 90.2% |
| 2016 | 48 | 71.9% | 99.8% | 111.5% | ||
| 2017 | 48 | 84.6% | 101.4% | 108.7% | ||
| 2018 | 48 | 95.6% | 102.1% | 108.0% | ||
| 2019 | 41 | 91.4% | 101.8% | 106.3% | ||
| 2020 | 44 | 94.1% | 97.7% | 101.5% | ||
| 2021 | 48 | 96.3% | 99.2% | 104.0% | ||
| 2022 | 46 | 97.6% | 100.0% | 106.3% | ||
| 2023 | 44 | 100.0% | 106.6% | 112.1% |
| Hover over boxplot or outliers for additional information |
| Chart generated 01/12/2024 |
| - Selenium, FIL, cICP-MS - |
| Lab: NWQL, PCode: 01145, MCode: PLM10 |
| Analysis Dates: 10/01/08 through 09/01/23 |
| Open Data Set |
| Boxplot Description |
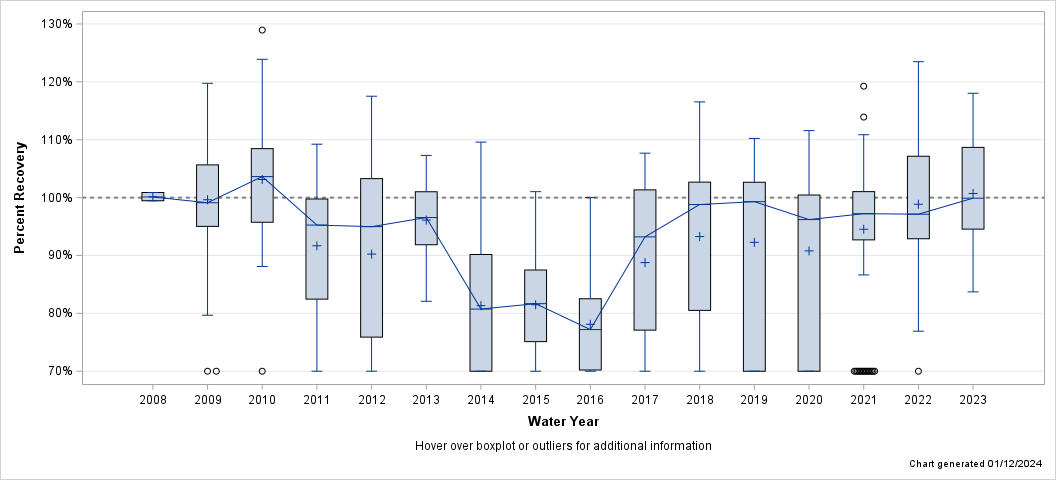
| Percent Recovery Statistics for Selenium, FIL, cICP-MS |
| Analyte | Parm-meth Code | Water Year | # of Samples |
25th Pctl | 50th Pctl (Median) |
75th Pctl |
|---|---|---|---|---|---|---|
| Selenium, FIL, cICP-MS | 01145PLM10 | 2008 | 3 | 99.4% | 100.1% | 100.9% |
| 2009 | 105 | 95.0% | 99.1% | 105.7% | ||
| 2010 | 132 | 95.7% | 103.6% | 108.5% | ||
| 2011 | 131 | 82.5% | 95.3% | 99.8% | ||
| 2012 | 132 | 75.9% | 95.0% | 103.3% | ||
| 2013 | 108 | 91.9% | 96.6% | 101.0% | ||
| 2014 | 83 | 58.1% | 80.7% | 90.2% | ||
| 2015 | 90 | 75.1% | 81.7% | 87.5% | ||
| 2016 | 90 | 70.2% | 77.2% | 82.5% | ||
| 2017 | 90 | 77.1% | 93.2% | 101.3% | ||
| 2018 | 90 | 80.5% | 98.8% | 102.7% | ||
| 2019 | 80 | 66.2% | 99.3% | 102.6% | ||
| 2020 | 85 | 67.0% | 96.2% | 100.4% | ||
| 2021 | 90 | 92.7% | 97.2% | 101.0% | ||
| 2022 | 88 | 92.9% | 97.1% | 107.1% | ||
| 2023 | 75 | 94.5% | 99.9% | 108.7% |
| Hover over boxplot or outliers for additional information |
| Chart generated 01/12/2024 |
| - Selenium, UNF, cICP-MS - |
| Lab: NWQL, PCode: 01147, MCode: PLM11 |
| Analysis Dates: 10/06/08 through 04/30/15 |
| Open Data Set |
| Boxplot Description |
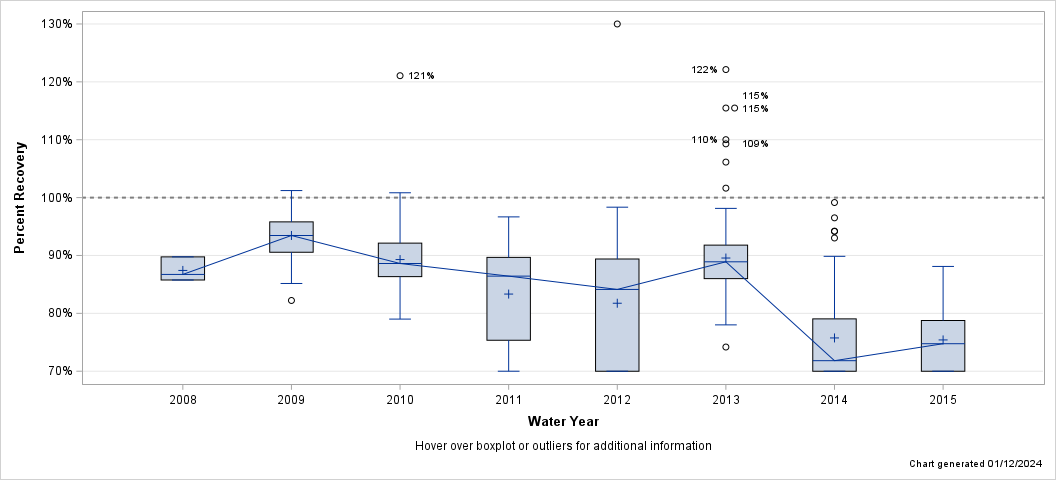
| Percent Recovery Statistics for Selenium, UNF, cICP-MS |
| Analyte | Parm-meth Code | Water Year | # of Samples |
25th Pctl | 50th Pctl (Median) |
75th Pctl |
|---|---|---|---|---|---|---|
| Selenium, UNF, cICP-MS | 01147PLM11 | 2008 | 3 | 85.8% | 86.7% | 89.8% |
| 2009 | 65 | 90.6% | 93.4% | 95.8% | ||
| 2010 | 84 | 86.3% | 88.6% | 92.1% | ||
| 2011 | 130 | 75.4% | 86.4% | 89.7% | ||
| 2012 | 83 | 67.9% | 84.1% | 89.4% | ||
| 2013 | 108 | 86.0% | 88.9% | 91.8% | ||
| 2014 | 83 | 52.5% | 71.8% | 79.0% | ||
| 2015 | 34 | 69.8% | 74.8% | 78.8% |
| Hover over boxplot or outliers for additional information |
| Chart generated 01/12/2024 |
| - Selenium, UNF, cICP-MS - |
| Lab: NWQL, PCode: 01147, MCode: PLM77 |
| Analysis Dates: 05/12/15 through 09/27/23 |
| Open Data Set |
| Boxplot Description |
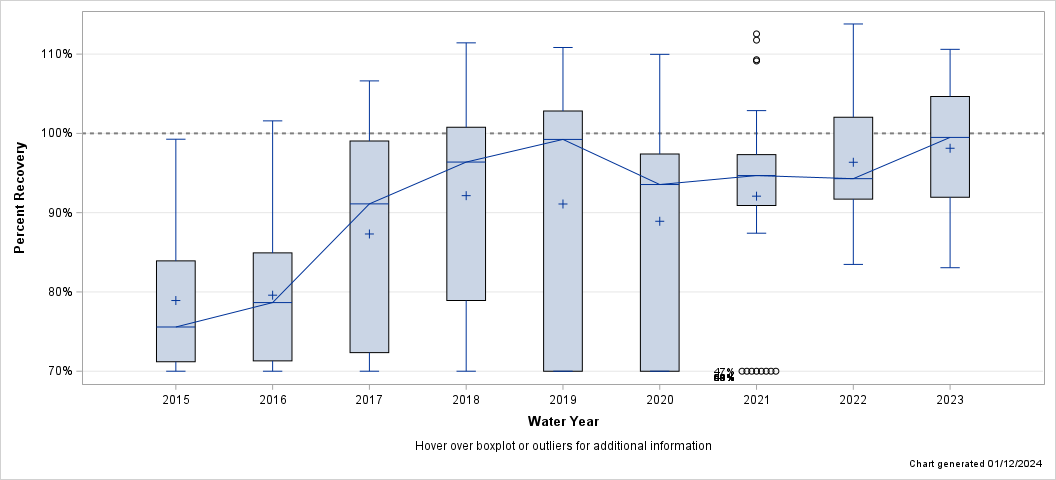
| Percent Recovery Statistics for Selenium, UNF, cICP-MS |
| Analyte | Parm-meth Code | Water Year | # of Samples |
25th Pctl | 50th Pctl (Median) |
75th Pctl |
|---|---|---|---|---|---|---|
| Selenium, UNF, cICP-MS | 01147PLM77 | 2015 | 32 | 71.2% | 75.6% | 83.9% |
| 2016 | 66 | 71.3% | 78.7% | 84.9% | ||
| 2017 | 66 | 72.3% | 91.1% | 99.0% | ||
| 2018 | 66 | 78.9% | 96.4% | 100.8% | ||
| 2019 | 56 | 57.5% | 99.2% | 102.8% | ||
| 2020 | 44 | 60.2% | 93.5% | 97.4% | ||
| 2021 | 48 | 90.9% | 94.7% | 97.3% | ||
| 2022 | 46 | 91.7% | 94.3% | 102.0% | ||
| 2023 | 44 | 91.9% | 99.5% | 104.7% |
| Hover over boxplot or outliers for additional information |
| Chart generated 01/12/2024 |
| - Silver, FIL, ICP-MS - |
| Lab: NWQL, PCode: 01075, MCode: PLM43 |
| Analysis Dates: 10/01/08 through 09/01/23 |
| Open Data Set |
| Boxplot Description |
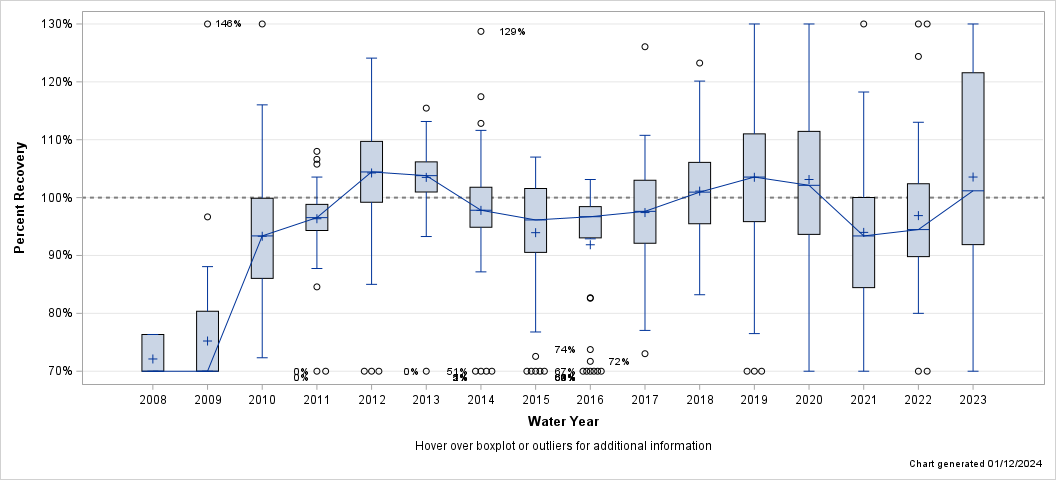
| Percent Recovery Statistics for Silver, FIL, ICP-MS |
| Analyte | Parm-meth Code | Water Year | # of Samples |
25th Pctl | 50th Pctl (Median) |
75th Pctl |
|---|---|---|---|---|---|---|
| Silver, FIL, ICP-MS | 01075PLM43 | 2008 | 3 | 29.2% | 58.7% | 76.3% |
| 2009 | 105 | 50.7% | 69.0% | 80.4% | ||
| 2010 | 132 | 86.1% | 93.4% | 99.9% | ||
| 2011 | 131 | 94.3% | 96.5% | 98.8% | ||
| 2012 | 132 | 99.2% | 104.4% | 109.7% | ||
| 2013 | 108 | 101.0% | 103.8% | 106.2% | ||
| 2014 | 83 | 94.9% | 97.8% | 101.8% | ||
| 2015 | 58 | 90.5% | 96.1% | 101.6% | ||
| 2016 | 44 | 93.0% | 96.7% | 98.4% | ||
| 2017 | 60 | 92.1% | 97.6% | 103.0% | ||
| 2018 | 76 | 95.5% | 100.9% | 106.1% | ||
| 2019 | 69 | 95.8% | 103.5% | 111.0% | ||
| 2020 | 58 | 93.6% | 102.1% | 111.4% | ||
| 2021 | 44 | 84.5% | 93.4% | 100.0% | ||
| 2022 | 42 | 89.8% | 94.5% | 102.4% | ||
| 2023 | 52 | 91.9% | 101.2% | 121.6% |
| Hover over boxplot or outliers for additional information |
| Chart generated 01/12/2024 |
| - Silver, UNF, ICP-MS - |
| Lab: NWQL, PCode: 01077, MCode: PLM48 |
| Analysis Dates: 10/15/08 through 04/30/15 |
| Open Data Set |
| Boxplot Description |
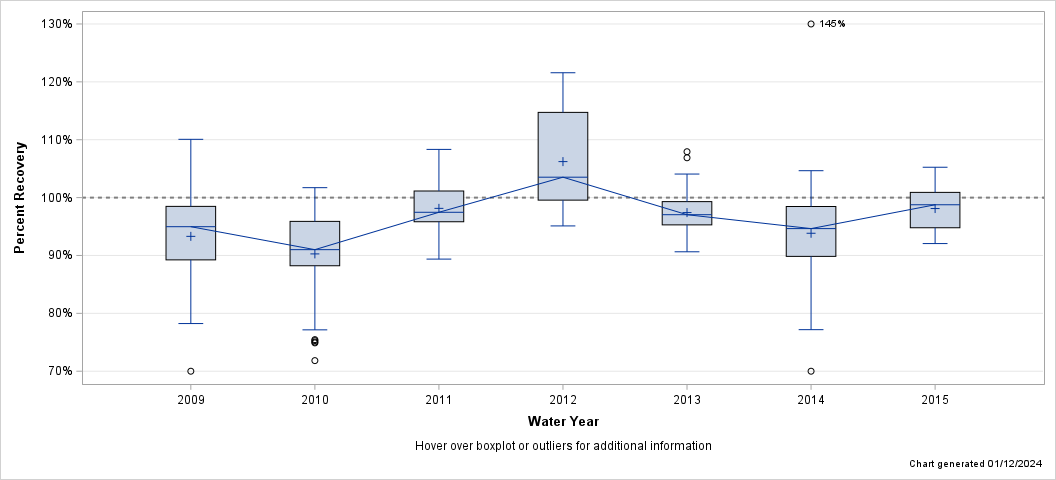
| Percent Recovery Statistics for Silver, UNF, ICP-MS |
| Analyte | Parm-meth Code | Water Year | # of Samples |
25th Pctl | 50th Pctl (Median) |
75th Pctl |
|---|---|---|---|---|---|---|
| Silver, UNF, ICP-MS | 01077PLM48 | 2009 | 65 | 89.2% | 95.0% | 98.5% |
| 2010 | 48 | 88.2% | 91.0% | 95.9% | ||
| 2011 | 48 | 95.8% | 97.5% | 101.1% | ||
| 2012 | 48 | 99.6% | 103.5% | 114.7% | ||
| 2013 | 48 | 95.3% | 97.0% | 99.3% | ||
| 2014 | 45 | 89.8% | 94.6% | 98.5% | ||
| 2015 | 27 | 94.8% | 98.8% | 100.9% |
| Hover over boxplot or outliers for additional information |
| Chart generated 01/12/2024 |
| - Silver, UNF, ICP-MS - |
| Lab: NWQL, PCode: 01077, MCode: PLM78 |
| Analysis Dates: 05/12/15 through 09/27/23 |
| Open Data Set |
| Boxplot Description |
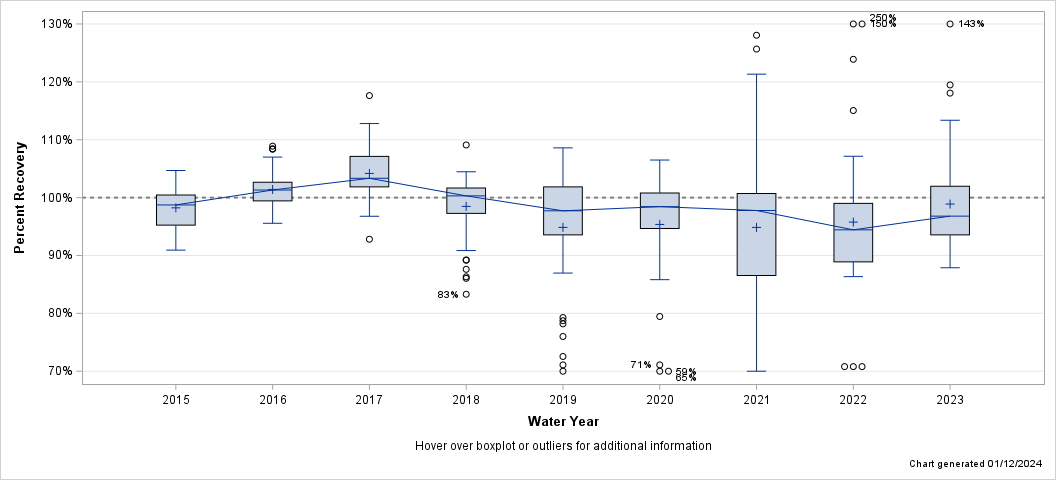
| Percent Recovery Statistics for Silver, UNF, ICP-MS |
| Analyte | Parm-meth Code | Water Year | # of Samples |
25th Pctl | 50th Pctl (Median) |
75th Pctl |
|---|---|---|---|---|---|---|
| Silver, UNF, ICP-MS | 01077PLM78 | 2015 | 21 | 95.2% | 98.7% | 100.5% |
| 2016 | 48 | 99.4% | 101.3% | 102.7% | ||
| 2017 | 48 | 101.8% | 103.3% | 107.1% | ||
| 2018 | 48 | 97.3% | 100.3% | 101.7% | ||
| 2019 | 41 | 93.6% | 97.7% | 101.8% | ||
| 2020 | 37 | 94.7% | 98.4% | 100.8% | ||
| 2021 | 41 | 86.5% | 97.8% | 100.7% | ||
| 2022 | 32 | 88.9% | 94.4% | 99.0% | ||
| 2023 | 36 | 93.6% | 96.8% | 102.0% |
| Hover over boxplot or outliers for additional information |
| Chart generated 01/12/2024 |
| - Strontium, FIL, ICP-MS - |
| Lab: NWQL, PCode: 01080, MCode: PLM40 |
| Analysis Dates: 10/01/08 through 09/01/23 |
| Open Data Set |
| Boxplot Description |
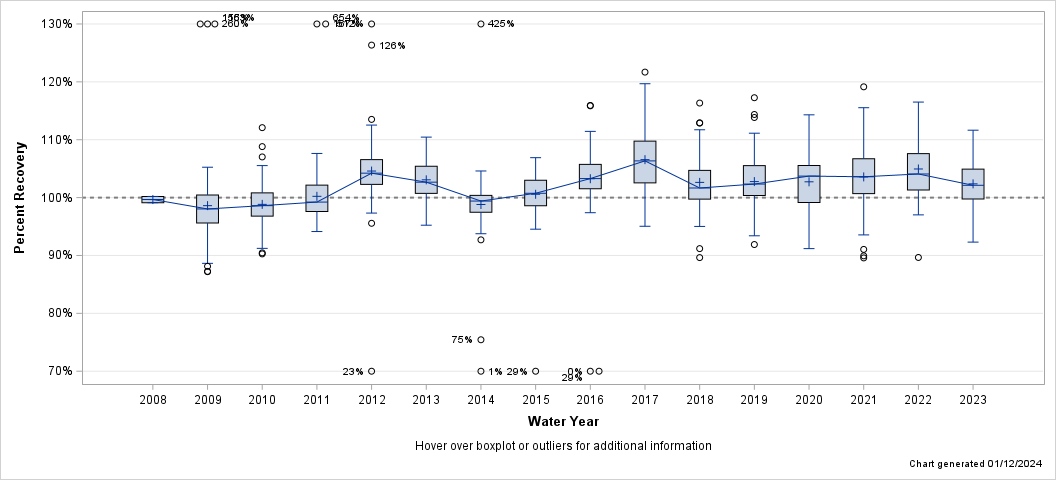
| Percent Recovery Statistics for Strontium, FIL, ICP-MS |
| Analyte | Parm-meth Code | Water Year | # of Samples |
25th Pctl | 50th Pctl (Median) |
75th Pctl |
|---|---|---|---|---|---|---|
| Strontium, FIL, ICP-MS | 01080PLM40 | 2008 | 3 | 99.1% | 99.7% | 100.2% |
| 2009 | 105 | 95.6% | 98.0% | 100.5% | ||
| 2010 | 132 | 96.8% | 98.6% | 100.8% | ||
| 2011 | 131 | 97.6% | 99.2% | 102.1% | ||
| 2012 | 132 | 102.3% | 104.2% | 106.6% | ||
| 2013 | 108 | 100.7% | 102.7% | 105.4% | ||
| 2014 | 83 | 97.5% | 99.4% | 100.4% | ||
| 2015 | 90 | 98.6% | 100.7% | 103.0% | ||
| 2016 | 90 | 101.5% | 103.3% | 105.7% | ||
| 2017 | 90 | 102.5% | 106.3% | 109.8% | ||
| 2018 | 90 | 99.7% | 101.7% | 104.7% | ||
| 2019 | 80 | 100.4% | 102.3% | 105.5% | ||
| 2020 | 85 | 99.2% | 103.7% | 105.6% | ||
| 2021 | 90 | 100.7% | 103.6% | 106.7% | ||
| 2022 | 88 | 101.3% | 104.1% | 107.6% | ||
| 2023 | 75 | 99.8% | 102.1% | 104.9% |
| Hover over boxplot or outliers for additional information |
| Chart generated 01/12/2024 |
| - Strontium, FIL, ICP-OES - |
| Lab: NWQL, PCode: 01080, MCode: PLA11 |
| Analysis Dates: 10/04/08 through 09/28/23 |
| Open Data Set |
| Boxplot Description |
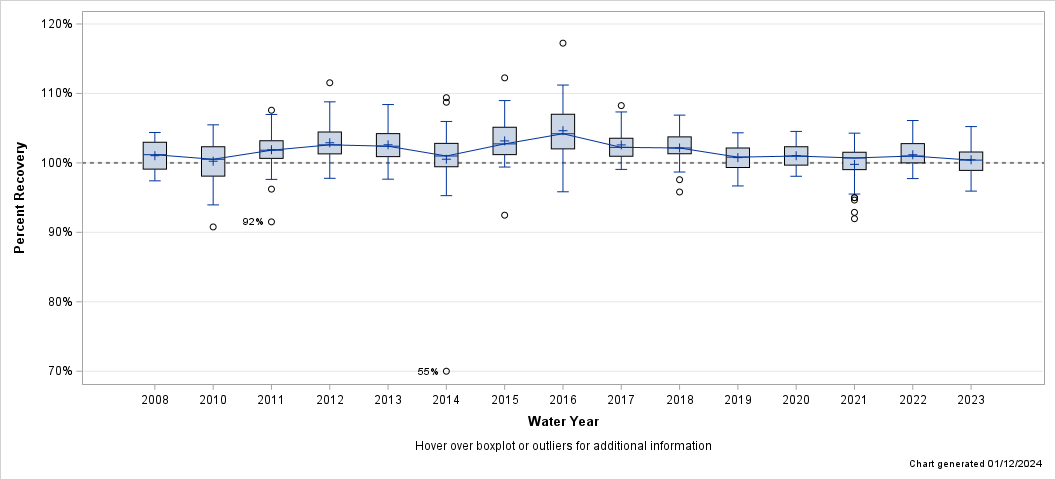
| Percent Recovery Statistics for Strontium, FIL, ICP-OES |
| Analyte | Parm-meth Code | Water Year | # of Samples |
25th Pctl | 50th Pctl (Median) |
75th Pctl |
|---|---|---|---|---|---|---|
| Strontium, FIL, ICP-OES | 01080PLA11 | 2008 | 4 | 99.1% | 101.2% | 103.0% |
| 2010 | 42 | 98.1% | 100.5% | 102.3% | ||
| 2011 | 94 | 100.6% | 101.8% | 103.2% | ||
| 2012 | 42 | 101.3% | 102.6% | 104.4% | ||
| 2013 | 42 | 100.9% | 102.4% | 104.2% | ||
| 2014 | 46 | 99.4% | 101.0% | 102.8% | ||
| 2015 | 42 | 101.2% | 102.7% | 105.1% | ||
| 2016 | 42 | 102.0% | 104.2% | 107.0% | ||
| 2017 | 42 | 101.0% | 102.2% | 103.5% | ||
| 2018 | 42 | 101.3% | 102.1% | 103.8% | ||
| 2019 | 39 | 99.3% | 100.8% | 102.1% | ||
| 2020 | 39 | 99.7% | 101.0% | 102.3% | ||
| 2021 | 42 | 99.0% | 100.7% | 101.5% | ||
| 2022 | 42 | 100.0% | 101.0% | 102.8% | ||
| 2023 | 41 | 98.9% | 100.4% | 101.6% |
| Hover over boxplot or outliers for additional information |
| Chart generated 01/12/2024 |
| - Strontium, UNF, ICP-MS - |
| Lab: NWQL, PCode: 01082, MCode: PLM48 |
| Analysis Dates: 10/11/12 through 04/30/15 |
| Open Data Set |
| Boxplot Description |
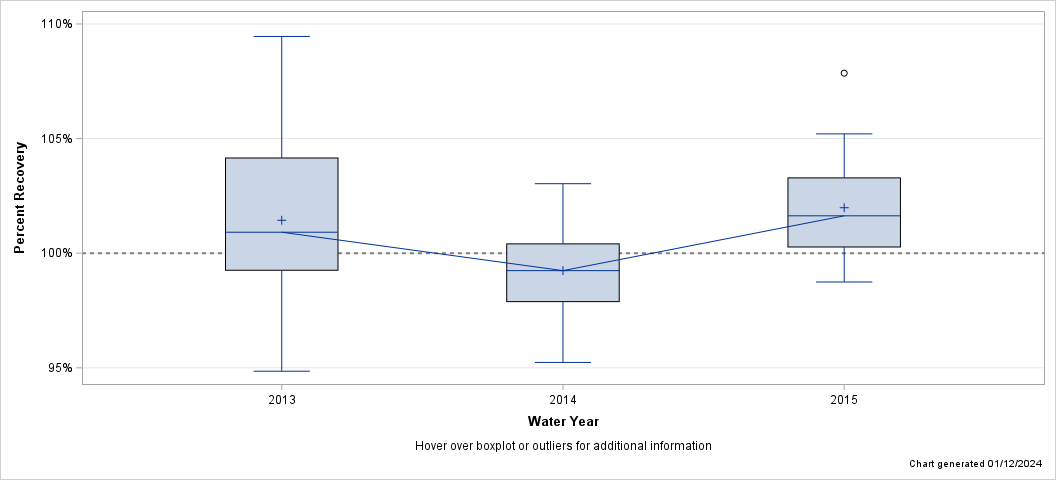
| Percent Recovery Statistics for Strontium, UNF, ICP-MS |
| Analyte | Parm-meth Code | Water Year | # of Samples |
25th Pctl | 50th Pctl (Median) |
75th Pctl |
|---|---|---|---|---|---|---|
| Strontium, UNF, ICP-MS | 01082PLM48 | 2013 | 48 | 99.3% | 100.9% | 104.2% |
| 2014 | 45 | 97.9% | 99.2% | 100.4% | ||
| 2015 | 27 | 100.3% | 101.6% | 103.3% |
| Hover over boxplot or outliers for additional information |
| Chart generated 01/12/2024 |
| - Strontium, UNF, ICP-MS - |
| Lab: NWQL, PCode: 01082, MCode: PLM78 |
| Analysis Dates: 05/12/15 through 09/27/23 |
| Open Data Set |
| Boxplot Description |
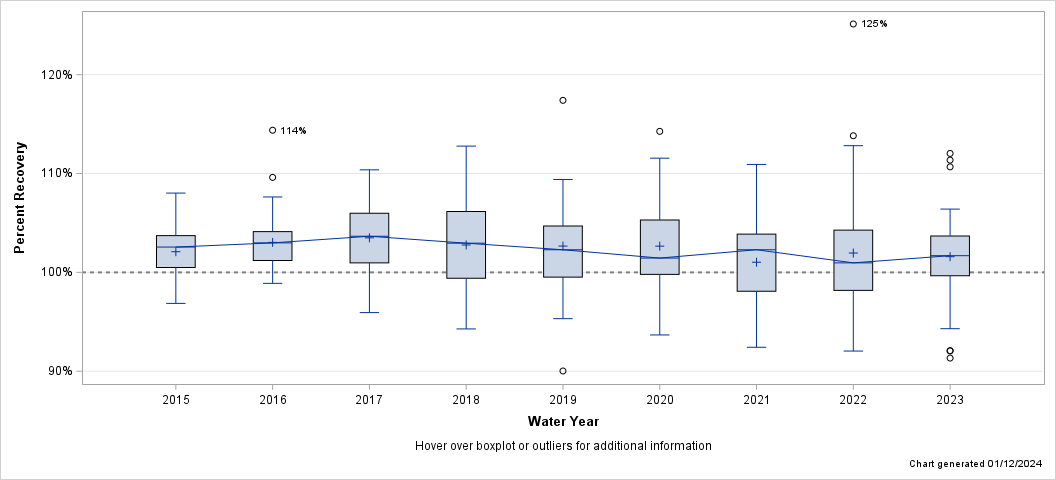
| Percent Recovery Statistics for Strontium, UNF, ICP-MS |
| Analyte | Parm-meth Code | Water Year | # of Samples |
25th Pctl | 50th Pctl (Median) |
75th Pctl |
|---|---|---|---|---|---|---|
| Strontium, UNF, ICP-MS | 01082PLM78 | 2015 | 21 | 100.5% | 102.6% | 103.7% |
| 2016 | 48 | 101.2% | 103.0% | 104.1% | ||
| 2017 | 48 | 101.0% | 103.7% | 106.0% | ||
| 2018 | 48 | 99.4% | 103.0% | 106.2% | ||
| 2019 | 41 | 99.5% | 102.3% | 104.7% | ||
| 2020 | 44 | 99.8% | 101.4% | 105.3% | ||
| 2021 | 48 | 98.1% | 102.3% | 103.9% | ||
| 2022 | 46 | 98.2% | 101.0% | 104.3% | ||
| 2023 | 44 | 99.7% | 101.7% | 103.7% |
| Hover over boxplot or outliers for additional information |
| Chart generated 01/12/2024 |
| - Thallium, FIL, ICP-MS - |
| Lab: NWQL, PCode: 01057, MCode: PLM40 |
| Analysis Dates: 10/01/08 through 08/31/23 |
| Open Data Set |
| Boxplot Description |
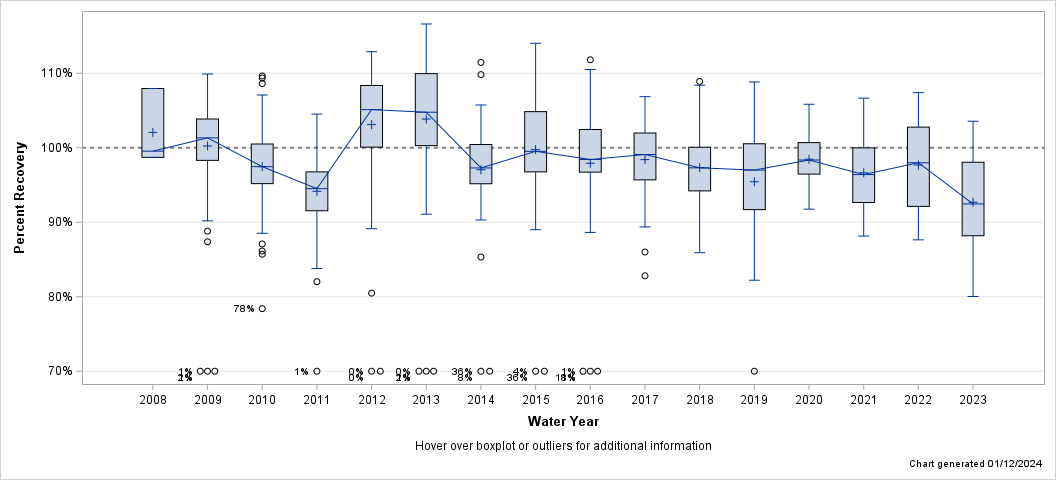
| Percent Recovery Statistics for Thallium, FIL, ICP-MS |
| Analyte | Parm-meth Code | Water Year | # of Samples |
25th Pctl | 50th Pctl (Median) |
75th Pctl |
|---|---|---|---|---|---|---|
| Thallium, FIL, ICP-MS | 01057PLM40 | 2008 | 3 | 98.7% | 99.5% | 108.0% |
| 2009 | 105 | 98.3% | 101.3% | 103.9% | ||
| 2010 | 132 | 95.2% | 97.5% | 100.5% | ||
| 2011 | 130 | 91.6% | 94.5% | 96.8% | ||
| 2012 | 84 | 100.1% | 105.1% | 108.4% | ||
| 2013 | 60 | 100.3% | 104.8% | 110.0% | ||
| 2014 | 61 | 95.2% | 97.3% | 100.4% | ||
| 2015 | 66 | 96.8% | 99.5% | 104.9% | ||
| 2016 | 66 | 96.7% | 98.4% | 102.5% | ||
| 2017 | 66 | 95.7% | 99.1% | 102.0% | ||
| 2018 | 80 | 94.2% | 97.3% | 100.1% | ||
| 2019 | 47 | 91.7% | 97.0% | 100.5% | ||
| 2020 | 37 | 96.5% | 98.4% | 100.7% | ||
| 2021 | 40 | 92.7% | 96.4% | 100.0% | ||
| 2022 | 46 | 92.1% | 98.0% | 102.8% | ||
| 2023 | 41 | 88.2% | 92.5% | 98.1% |
| Hover over boxplot or outliers for additional information |
| Chart generated 01/12/2024 |
| - Thallium, UNF, ICP-MS - |
| Lab: NWQL, PCode: 01059, MCode: PLM48 |
| Analysis Dates: 10/15/08 through 10/08/14 |
| Open Data Set |
| Boxplot Description |
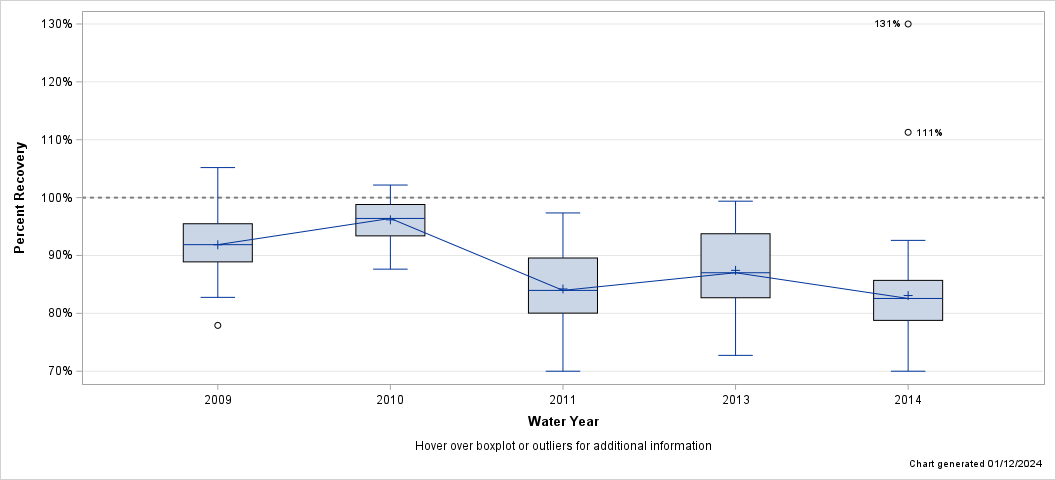
| Percent Recovery Statistics for Thallium, UNF, ICP-MS |
| Analyte | Parm-meth Code | Water Year | # of Samples |
25th Pctl | 50th Pctl (Median) |
75th Pctl |
|---|---|---|---|---|---|---|
| Thallium, UNF, ICP-MS | 01059PLM48 | 2009 | 39 | 88.9% | 91.9% | 95.5% |
| 2010 | 48 | 93.4% | 96.4% | 98.8% | ||
| 2011 | 48 | 80.0% | 84.0% | 89.6% | ||
| 2013 | 48 | 82.7% | 87.0% | 93.8% | ||
| 2014 | 45 | 78.8% | 82.6% | 85.7% |
| Hover over boxplot or outliers for additional information |
| Chart generated 01/12/2024 |
| - Uranium, FIL, ICP-MS - |
| Lab: NWQL, PCode: 22703, MCode: PLM43 |
| Analysis Dates: 10/01/08 through 09/01/23 |
| Open Data Set |
| Boxplot Description |
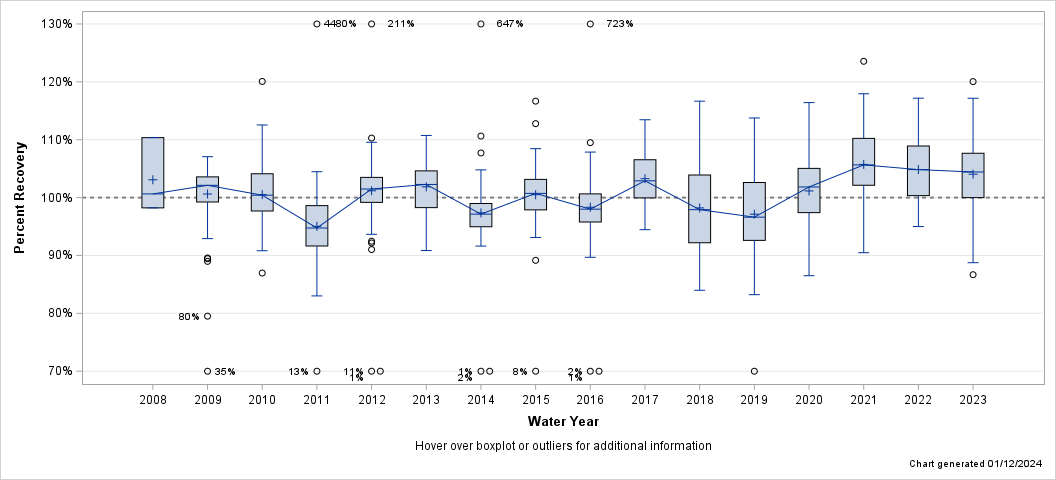
| Percent Recovery Statistics for Uranium, FIL, ICP-MS |
| Analyte | Parm-meth Code | Water Year | # of Samples |
25th Pctl | 50th Pctl (Median) |
75th Pctl |
|---|---|---|---|---|---|---|
| Uranium, FIL, ICP-MS | 22703PLM43 | 2008 | 3 | 98.2% | 100.6% | 110.4% |
| 2009 | 105 | 99.2% | 102.1% | 103.6% | ||
| 2010 | 132 | 97.7% | 100.4% | 104.1% | ||
| 2011 | 131 | 91.6% | 94.7% | 98.6% | ||
| 2012 | 132 | 99.2% | 101.5% | 103.5% | ||
| 2013 | 108 | 98.3% | 102.3% | 104.6% | ||
| 2014 | 83 | 95.0% | 97.1% | 99.0% | ||
| 2015 | 90 | 97.9% | 100.7% | 103.2% | ||
| 2016 | 90 | 95.8% | 98.0% | 100.6% | ||
| 2017 | 90 | 99.9% | 102.9% | 106.5% | ||
| 2018 | 90 | 92.2% | 97.9% | 103.9% | ||
| 2019 | 80 | 92.6% | 96.6% | 102.6% | ||
| 2020 | 85 | 97.4% | 101.8% | 105.0% | ||
| 2021 | 90 | 102.1% | 105.7% | 110.2% | ||
| 2022 | 88 | 100.3% | 104.8% | 108.9% | ||
| 2023 | 75 | 100.0% | 104.4% | 107.7% |
| Hover over boxplot or outliers for additional information |
| Chart generated 01/12/2024 |
| - Uranium, UNF, ICP-MS - |
| Lab: NWQL, PCode: 28011, MCode: PLM48 |
| Analysis Dates: 10/15/08 through 04/22/15 |
| Open Data Set |
| Boxplot Description |
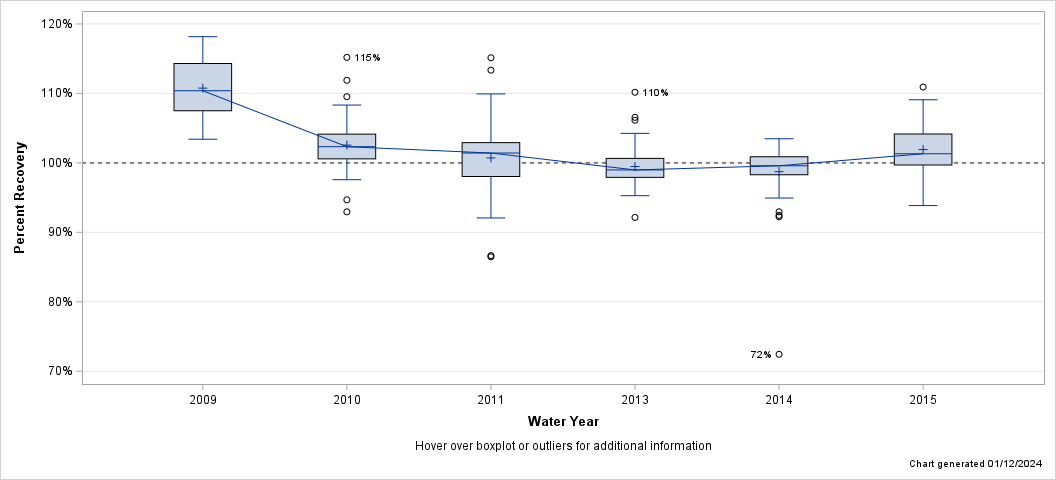
| Percent Recovery Statistics for Uranium, UNF, ICP-MS |
| Analyte | Parm-meth Code | Water Year | # of Samples |
25th Pctl | 50th Pctl (Median) |
75th Pctl |
|---|---|---|---|---|---|---|
| Uranium, UNF, ICP-MS | 28011PLM48 | 2009 | 39 | 107.5% | 110.4% | 114.3% |
| 2010 | 48 | 100.6% | 102.3% | 104.1% | ||
| 2011 | 48 | 98.0% | 101.4% | 102.9% | ||
| 2013 | 48 | 97.9% | 99.0% | 100.6% | ||
| 2014 | 45 | 98.3% | 99.6% | 100.9% | ||
| 2015 | 26 | 99.7% | 101.3% | 104.2% |
| Hover over boxplot or outliers for additional information |
| Chart generated 01/12/2024 |
| - Uranium, UNF, ICP-MS - |
| Lab: NWQL, PCode: 28011, MCode: PLM78 |
| Analysis Dates: 05/12/15 through 09/27/23 |
| Open Data Set |
| Boxplot Description |
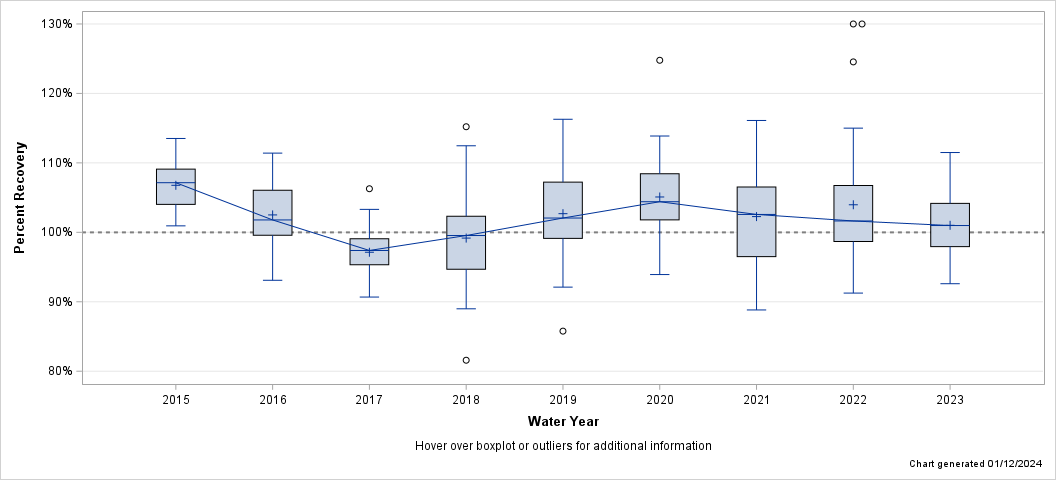
| Percent Recovery Statistics for Uranium, UNF, ICP-MS |
| Analyte | Parm-meth Code | Water Year | # of Samples |
25th Pctl | 50th Pctl (Median) |
75th Pctl |
|---|---|---|---|---|---|---|
| Uranium, UNF, ICP-MS | 28011PLM78 | 2015 | 22 | 104.0% | 107.1% | 109.1% |
| 2016 | 48 | 99.6% | 101.8% | 106.1% | ||
| 2017 | 48 | 95.3% | 97.4% | 99.1% | ||
| 2018 | 48 | 94.7% | 99.5% | 102.3% | ||
| 2019 | 41 | 99.1% | 102.1% | 107.2% | ||
| 2020 | 44 | 101.8% | 104.4% | 108.4% | ||
| 2021 | 48 | 96.5% | 102.6% | 106.5% | ||
| 2022 | 46 | 98.7% | 101.6% | 106.7% | ||
| 2023 | 44 | 97.9% | 101.0% | 104.2% |
| Hover over boxplot or outliers for additional information |
| Chart generated 01/12/2024 |
| - Vanadium, FIL, cICP-MS - |
| Lab: NWQL, PCode: 01085, MCode: PLM10 |
| Analysis Dates: 10/01/08 through 09/01/23 |
| Open Data Set |
| Boxplot Description |
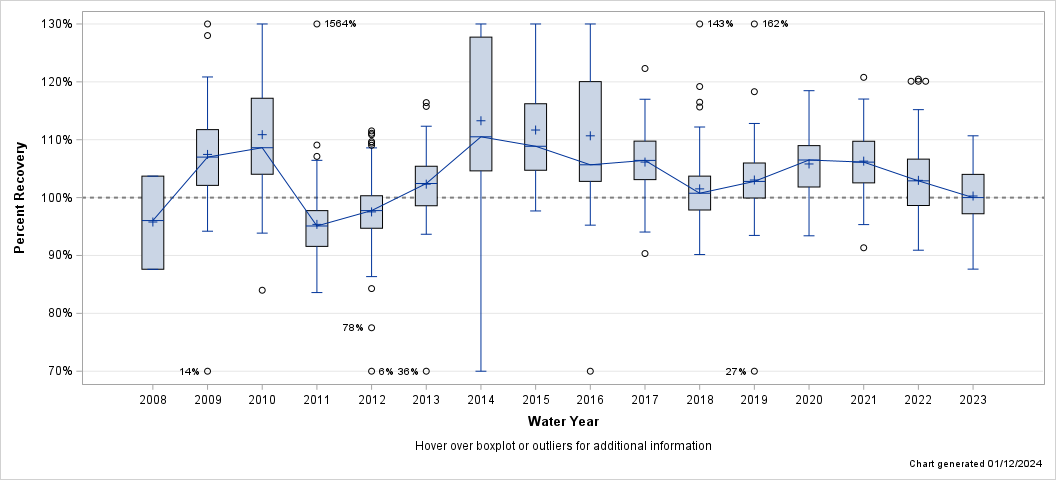
| Percent Recovery Statistics for Vanadium, FIL, cICP-MS |
| Analyte | Parm-meth Code | Water Year | # of Samples |
25th Pctl | 50th Pctl (Median) |
75th Pctl |
|---|---|---|---|---|---|---|
| Vanadium, FIL, cICP-MS | 01085PLM10 | 2008 | 3 | 87.6% | 96.0% | 103.7% |
| 2009 | 105 | 102.1% | 107.0% | 111.7% | ||
| 2010 | 132 | 104.0% | 108.6% | 117.2% | ||
| 2011 | 131 | 91.6% | 95.1% | 97.8% | ||
| 2012 | 132 | 94.7% | 97.8% | 100.3% | ||
| 2013 | 108 | 98.6% | 102.4% | 105.4% | ||
| 2014 | 83 | 104.6% | 110.5% | 127.7% | ||
| 2015 | 90 | 104.7% | 108.9% | 116.2% | ||
| 2016 | 90 | 102.8% | 105.7% | 120.0% | ||
| 2017 | 90 | 103.1% | 106.4% | 109.8% | ||
| 2018 | 90 | 97.9% | 100.8% | 103.7% | ||
| 2019 | 80 | 99.9% | 102.8% | 106.0% | ||
| 2020 | 85 | 101.8% | 106.5% | 109.0% | ||
| 2021 | 90 | 102.5% | 106.1% | 109.7% | ||
| 2022 | 88 | 98.6% | 102.9% | 106.6% | ||
| 2023 | 75 | 97.2% | 100.0% | 104.0% |
| Hover over boxplot or outliers for additional information |
| Chart generated 01/12/2024 |
| - Vanadium, UNF, ICP-OES - |
| Lab: NWQL, PCode: 01087, MCode: PLA15 |
| Analysis Dates: 11/21/08 through 11/12/09 |
| Open Data Set |
| Boxplot Description |
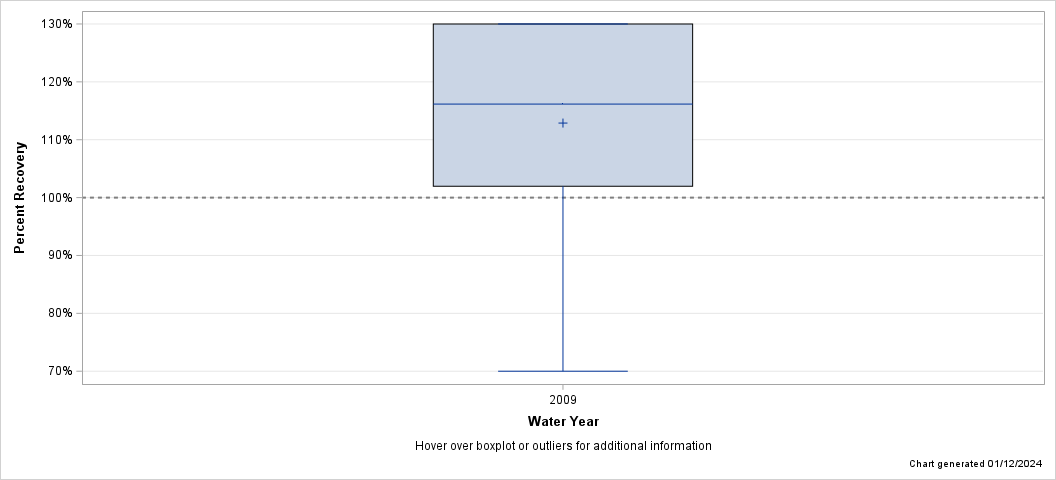
| Percent Recovery Statistics for Vanadium, UNF, ICP-OES |
| Analyte | Parm-meth Code | Water Year | # of Samples |
25th Pctl | 50th Pctl (Median) |
75th Pctl |
|---|---|---|---|---|---|---|
| Vanadium, UNF, ICP-OES | 01087PLA15 | 2009 | 32 | 102.0% | 116.2% | 143.4% |
| Hover over boxplot or outliers for additional information |
| Chart generated 01/12/2024 |
| - Vanadium, UNF, cICP-MS - |
| Lab: NWQL, PCode: 01087, MCode: PLM11 |
| Analysis Dates: 10/24/12 through 11/26/13 |
| Open Data Set |
| Boxplot Description |
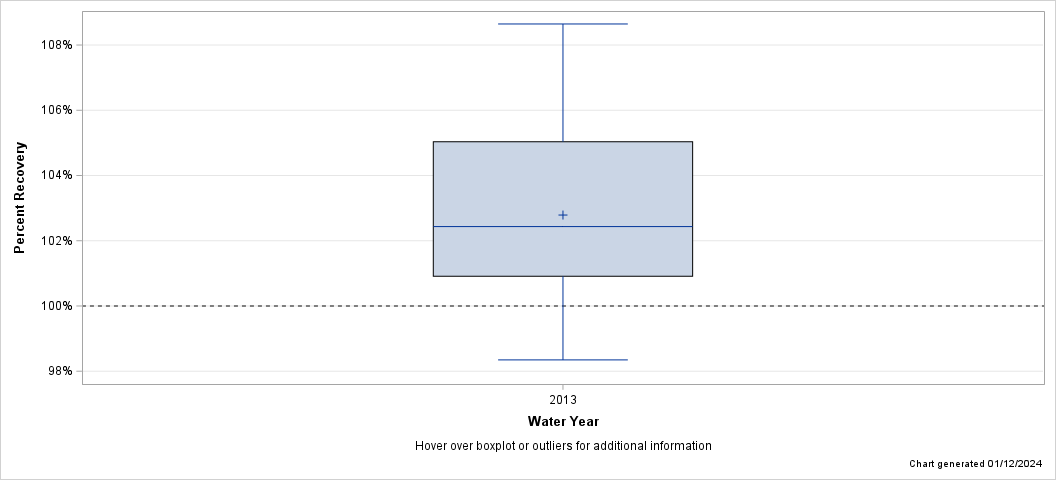
| Percent Recovery Statistics for Vanadium, UNF, cICP-MS |
| Analyte | Parm-meth Code | Water Year | # of Samples |
25th Pctl | 50th Pctl (Median) |
75th Pctl |
|---|---|---|---|---|---|---|
| Vanadium, UNF, cICP-MS | 01087PLM11 | 2013 | 24 | 100.9% | 102.4% | 105.0% |
| Hover over boxplot or outliers for additional information |
| Chart generated 01/12/2024 |
| - Zinc, FIL, ICP-OES - |
| Lab: NWQL, PCode: 01090, MCode: PLA11 |
| Analysis Dates: 11/02/12 through 09/28/23 |
| Open Data Set |
| Boxplot Description |
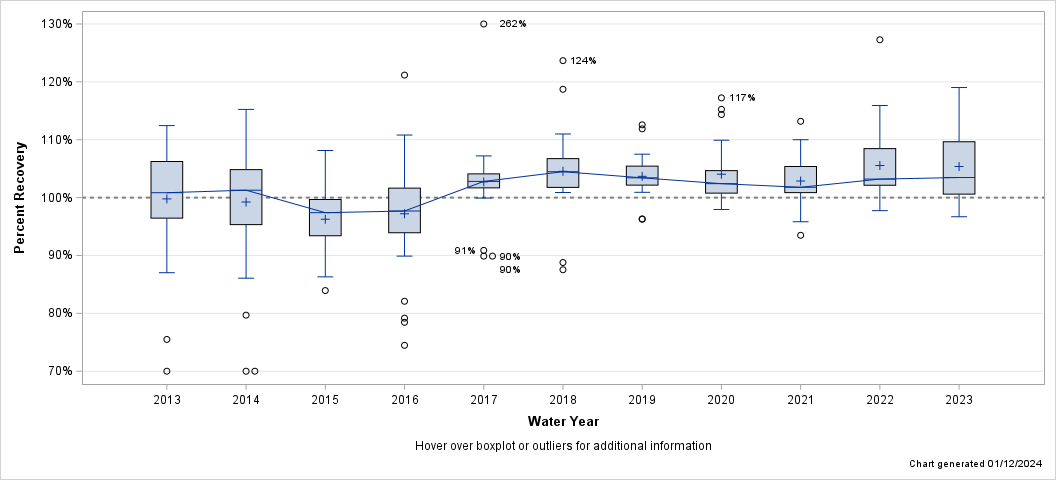
| Percent Recovery Statistics for Zinc, FIL, ICP-OES |
| Analyte | Parm-meth Code | Water Year | # of Samples |
25th Pctl | 50th Pctl (Median) |
75th Pctl |
|---|---|---|---|---|---|---|
| Zinc, FIL, ICP-OES | 01090PLA11 | 2013 | 42 | 96.4% | 100.8% | 106.2% |
| 2014 | 46 | 95.3% | 101.3% | 104.8% | ||
| 2015 | 42 | 93.4% | 97.4% | 99.7% | ||
| 2016 | 41 | 93.9% | 97.7% | 101.6% | ||
| 2017 | 24 | 101.7% | 102.8% | 104.1% | ||
| 2018 | 24 | 101.8% | 104.5% | 106.7% | ||
| 2019 | 21 | 102.2% | 103.4% | 105.4% | ||
| 2020 | 24 | 100.8% | 102.4% | 104.7% | ||
| 2021 | 24 | 100.9% | 101.8% | 105.4% | ||
| 2022 | 24 | 102.1% | 103.2% | 108.5% | ||
| 2023 | 24 | 100.6% | 103.5% | 109.7% |
| Hover over boxplot or outliers for additional information |
| Chart generated 01/12/2024 |
| - Zinc, FIL, cICP-MS - |
| Lab: NWQL, PCode: 01090, MCode: PLM10 |
| Analysis Dates: 10/01/08 through 09/01/23 |
| Open Data Set |
| Boxplot Description |
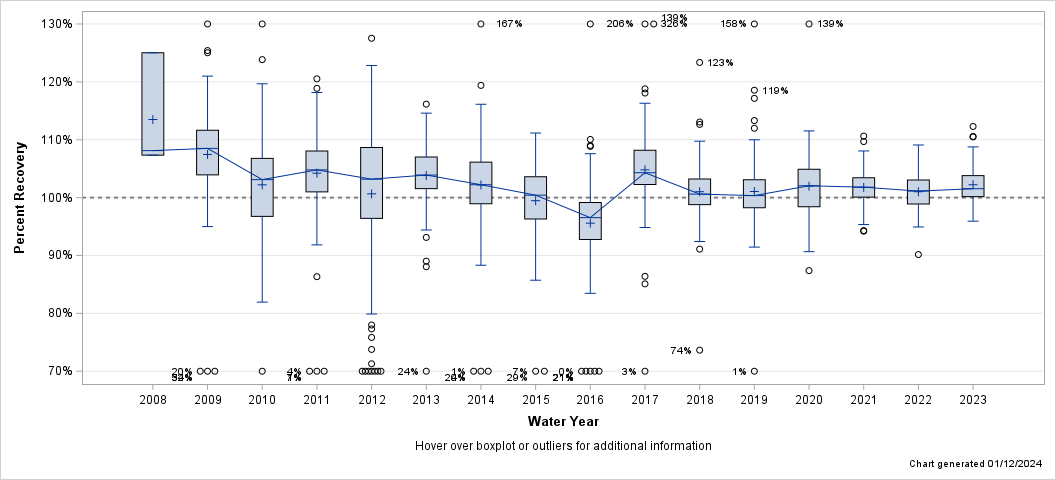
| Percent Recovery Statistics for Zinc, FIL, cICP-MS |
| Analyte | Parm-meth Code | Water Year | # of Samples |
25th Pctl | 50th Pctl (Median) |
75th Pctl |
|---|---|---|---|---|---|---|
| Zinc, FIL, cICP-MS | 01090PLM10 | 2008 | 3 | 107.3% | 108.1% | 125.0% |
| 2009 | 105 | 103.9% | 108.5% | 111.6% | ||
| 2010 | 132 | 96.8% | 103.1% | 106.8% | ||
| 2011 | 131 | 101.0% | 104.8% | 108.0% | ||
| 2012 | 132 | 96.4% | 103.2% | 108.7% | ||
| 2013 | 108 | 101.6% | 103.9% | 107.0% | ||
| 2014 | 83 | 98.9% | 102.2% | 106.1% | ||
| 2015 | 90 | 96.3% | 100.4% | 103.6% | ||
| 2016 | 90 | 92.8% | 96.5% | 99.2% | ||
| 2017 | 90 | 102.3% | 104.3% | 108.2% | ||
| 2018 | 90 | 98.8% | 100.6% | 103.2% | ||
| 2019 | 80 | 98.2% | 100.3% | 103.1% | ||
| 2020 | 85 | 98.4% | 102.0% | 104.9% | ||
| 2021 | 90 | 100.1% | 101.8% | 103.4% | ||
| 2022 | 88 | 98.9% | 101.1% | 103.0% | ||
| 2023 | 75 | 100.2% | 101.5% | 103.8% |
| Hover over boxplot or outliers for additional information |
| Chart generated 01/12/2024 |
| - Zinc, UNF, ICP-OES - |
| Lab: NWQL, PCode: 01092, MCode: PLA15 |
| Analysis Dates: 11/07/14 through 03/24/15 |
| Open Data Set |
| Boxplot Description |
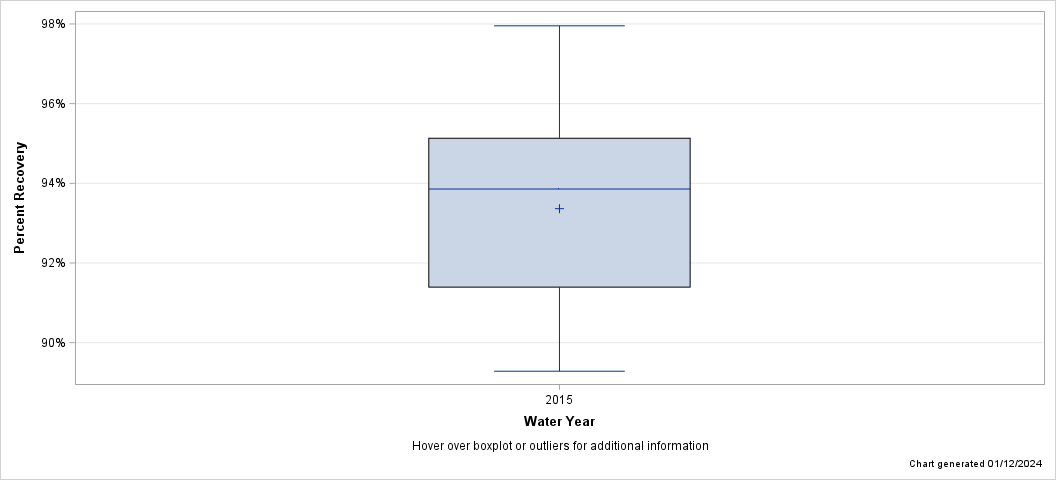
| Percent Recovery Statistics for Zinc, UNF, ICP-OES |
| Analyte | Parm-meth Code | Water Year | # of Samples |
25th Pctl | 50th Pctl (Median) |
75th Pctl |
|---|---|---|---|---|---|---|
| Zinc, UNF, ICP-OES | 01092PLA15 | 2015 | 16 | 91.4% | 93.9% | 95.1% |
| Hover over boxplot or outliers for additional information |
| Chart generated 01/12/2024 |
| - Zinc, UNF, ICP-OES - |
| Lab: NWQL, PCode: 01092, MCode: PLO07 |
| Analysis Dates: 05/28/15 through 09/20/23 |
| Open Data Set |
| Boxplot Description |
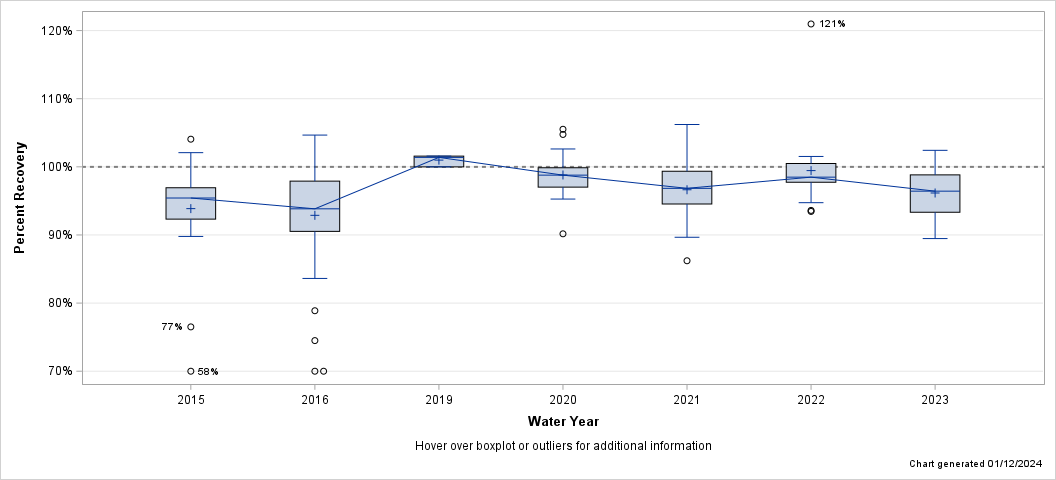
| Percent Recovery Statistics for Zinc, UNF, ICP-OES |
| Analyte | Parm-meth Code | Water Year | # of Samples |
25th Pctl | 50th Pctl (Median) |
75th Pctl |
|---|---|---|---|---|---|---|
| Zinc, UNF, ICP-OES | 01092PLO07 | 2015 | 26 | 92.3% | 95.4% | 96.9% |
| 2016 | 41 | 90.5% | 93.8% | 97.9% | ||
| 2019 | 3 | 100.0% | 101.4% | 101.6% | ||
| 2020 | 24 | 97.0% | 98.8% | 99.9% | ||
| 2021 | 24 | 94.5% | 96.8% | 99.3% | ||
| 2022 | 24 | 97.7% | 98.5% | 100.5% | ||
| 2023 | 23 | 93.3% | 96.4% | 98.8% |
| Hover over boxplot or outliers for additional information |
| Chart generated 01/12/2024 |
| - Zinc, UNF, cICP-MS - |
| Lab: NWQL, PCode: 01092, MCode: PLM11 |
| Analysis Dates: 10/06/08 through 04/30/15 |
| Open Data Set |
| Boxplot Description |
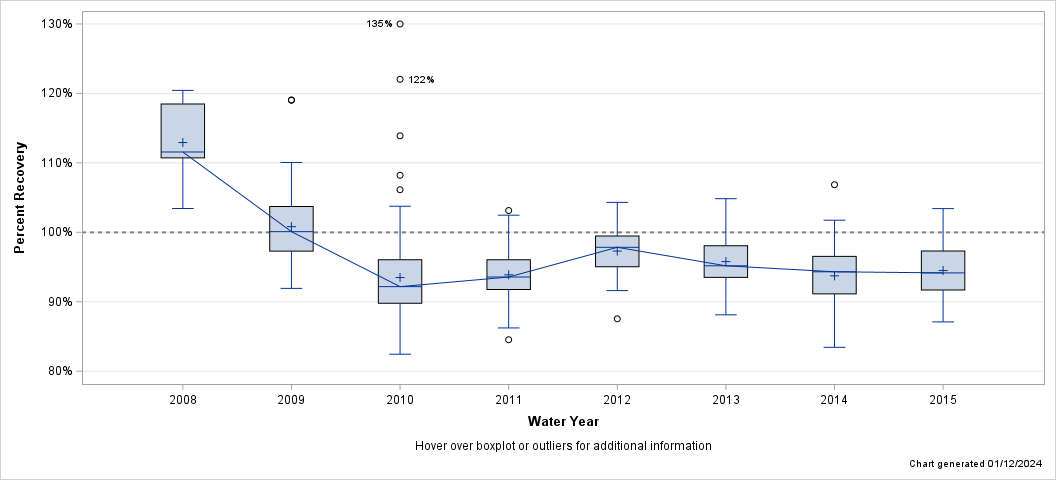
| Percent Recovery Statistics for Zinc, UNF, cICP-MS |
| Analyte | Parm-meth Code | Water Year | # of Samples |
25th Pctl | 50th Pctl (Median) |
75th Pctl |
|---|---|---|---|---|---|---|
| Zinc, UNF, cICP-MS | 01092PLM11 | 2008 | 5 | 110.7% | 111.6% | 118.5% |
| 2009 | 103 | 97.3% | 100.1% | 103.7% | ||
| 2010 | 131 | 89.8% | 92.2% | 96.1% | ||
| 2011 | 130 | 91.8% | 93.6% | 96.1% | ||
| 2012 | 83 | 95.0% | 97.8% | 99.5% | ||
| 2013 | 108 | 93.5% | 95.2% | 98.1% | ||
| 2014 | 83 | 91.1% | 94.3% | 96.5% | ||
| 2015 | 33 | 91.7% | 94.2% | 97.3% |
| Hover over boxplot or outliers for additional information |
| Chart generated 01/12/2024 |
| - Zinc, UNF, cICP-MS - |
| Lab: NWQL, PCode: 01092, MCode: PLM77 |
| Analysis Dates: 05/12/15 through 09/27/23 |
| Open Data Set |
| Boxplot Description |
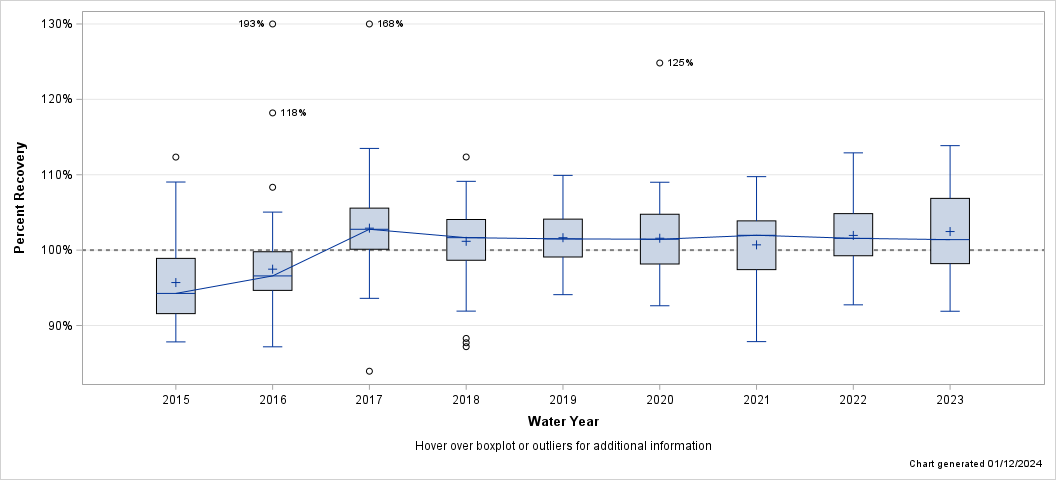
| Percent Recovery Statistics for Zinc, UNF, cICP-MS |
| Analyte | Parm-meth Code | Water Year | # of Samples |
25th Pctl | 50th Pctl (Median) |
75th Pctl |
|---|---|---|---|---|---|---|
| Zinc, UNF, cICP-MS | 01092PLM77 | 2015 | 33 | 91.6% | 94.3% | 98.9% |
| 2016 | 66 | 94.7% | 96.6% | 99.8% | ||
| 2017 | 66 | 100.1% | 102.8% | 105.6% | ||
| 2018 | 66 | 98.7% | 101.7% | 104.1% | ||
| 2019 | 56 | 99.1% | 101.5% | 104.1% | ||
| 2020 | 44 | 98.2% | 101.4% | 104.8% | ||
| 2021 | 48 | 97.4% | 102.0% | 103.9% | ||
| 2022 | 46 | 99.2% | 101.6% | 104.8% | ||
| 2023 | 43 | 98.2% | 101.4% | 106.9% |
| Hover over boxplot or outliers for additional information |
| Chart generated 01/12/2024 |